1. top Shows Node Resource Usage Above 100%
| |
This is because usage is computed against allocatable resources by default, which excludes the portion reserved by Kubelet. In the kubectl source you can see:
| |
If you need to see the node’s total resource usage, add the --show-capacity flag:
| |
In fact, Allocatable and Capacity can be seen directly on the node object:
| |
The specific reservation amounts can be found in Kubelet’s configuration file /var/lib/kubelet/config.yaml or in the startup flags --system-reserved=cpu=1,memory=2Gi --kube-reserved=cpu=1,memory=2Gi. For details, see https://kubernetes.io/zh-cn/docs/tasks/administer-cluster/reserve-compute-resources/ .
Allocatable = Capacity - Reserved - Evicted Threshold, where Evicted Threshold depends on the resource and is usually a very small value or ratio.
2. top node and Grafana Data Disagree
2.1 free and node_memory_Mem Share the Same Source
Using free to view node resource usage:
| |
Grafana node resource usage is as follows:
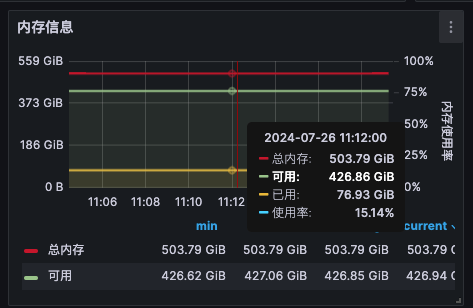
The PromQL used is:
- Total memory,
node_memory_MemTotal_bytes{instance=~\"$node\"} - Used,
node_memory_MemTotal_bytes{instance=~\"$node\"} - node_memory_MemAvailable_bytes{instance=~\"$node\"}
Numerically, free and Grafana data are basically consistent.
This is because the node_memory_Mem metrics that Grafana uses, collected by Node Exporter, come from the host’s /proc/meminfo — the same source as free -h output.
2.2 top Uses Metrics Collected by metrics-server
Viewing node resource usage with top
| |
Simulating the top command’s request to metrics-server:
| |
The memory usage here is about 130 Gi; 130 / 503 = 25.8%, basically consistent with kubectl top node.
2.3 metrics-server’s Data Comes from Kubelet
From the metrics-server source you can see that it is requesting data from Kubelet.
| |
Simulating metrics-server’s request to Kubelet
| |
As expected, the monitoring data from metrics-server and from the Kubelet API is the same.
2.4 What Is Different About the node_memory_working_set_bytes Metric
- top uses
node_memory_working_set_bytes, a metric provided by Kubelet
It includes memory currently in use and active cache, but excludes cache and buffers that can be reclaimed immediately — mainly inactive file cache. Its data comes from /sys/fs/cgroup.
- Grafana uses
node_memory_MemTotal_bytes-node_memory_MemAvailable_bytes, metrics provided by Node Exporter
It includes memory currently in use but excludes cache. Its data comes from /proc/meminfo.
As we saw earlier, top shows memory usage of about 130 Gi while Grafana shows about 77 Gi; the 53 Gi difference is cache that cannot be reclaimed immediately. But because the two methods use different data sources, that 53 Gi cannot be analyzed in more detail.
2.5 Kubelet limit Uses container_memory_working_set_bytes
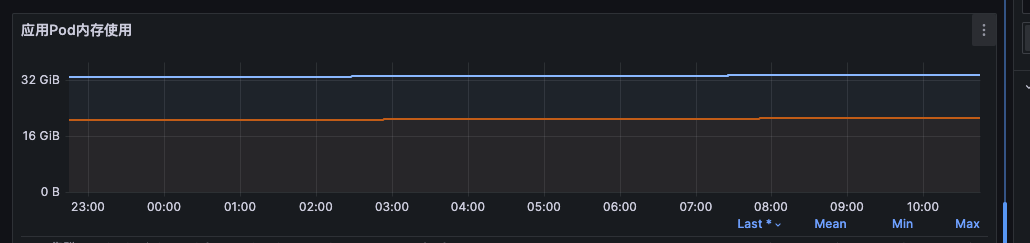
For Pods, the memory usage seen via top and Grafana may be the same, because most Grafana panels plot Pod memory usage with container_memory_working_set_bytes, which matches top’s calculation.
The key question here is: which metric does Kubelet use to evict Pods? The answer is container_memory_working_set_bytes .
container_memory_working_set_bytes better represents a container’s real memory usage.
The figure below illustrates the difference between container_memory_working_set_bytes (about 18GiB) and container_memory_usage_bytes (about 33GiB).
3. Summary
The host kernel version for the data collected in this article is 5.4.0-48-generic. The main points are:
- Because Kubelet reserves resources, top node resource usage may exceed 100%; use
--show-capacityto see total resource usage - The commonly used node resource usage rate (
node_memory_MemTotal_bytes-node_memory_MemAvailable_bytes) /node_memory_MemTotal_bytesignores active cache, so the rate reads a bit lower than what top node shows. In the example above, Grafana displays 15% usage while top node displays 28%. - Kubelet uses
container_memory_working_set_bytesfor Pod eviction, the same memory usage that top pod shows
