This page looks best with JavaScript enabled

Using In-Cluster Prometheus to Collect Etcd Metrics

 ·  ☕ 2 min read

1. Skipping Certificate Verification Prevents Scraping

If you can skip TLS authentication when scraping metrics, that is the easiest path. The Prometheus ConfigMap configuration looks like this:

1
2
3
4
5
6
7
8
9
- job_name: etcd
  metrics_path: /metrics
  scheme: https
  tls_config:
    insecure_skip_verify: true
  static_configs:
    - targets: ["1.1.1.1:2379"]
    - targets: ["2.2.2.2:2379"]
    - targets: ["3.3.3.3:2379"]

But Prometheus Targets reports Get "https://3.3.3.3:2379/metrics": remote error: tls: bad certificate

The error on the targets page looks like this:

2. Verifying the Scrape Request with curl

  • Skipping the certificate
1
2
3
curl https://1.1.1.1:2379/metrics -k

curl: (35) error:1401E412:SSL routines:CONNECT_CR_FINISHED:sslv3 alert bad certificate

I did not find a solution to this error, so I switched directly to the approach that requires TLS.

  • Configuring certificates to fetch data with curl
1
curl https://1.1.1.1:2379/metrics --cacert /etc/ssl/etcd/ssl/ca.pem --cert /etc/ssl/etcd/ssl/node-node1.pem --key /etc/ssl/etcd/ssl/node-node1-key.pem

The metrics data is returned successfully.

The node-node1.pem certificate here should contain the domains for all Etcd node IPs. You can inspect the certificate information with openssl x509 -noout -text -in /etc/ssl/etcd/ssl/node-node1.pem.

3. Adding an Etcd TLS Scrape to the Cluster Prometheus

  • Creating the credential
1
kubectl -n monitor create secret generic etcd-certs --from-file=/etc/ssl/etcd/ssl/ca.pem --from-file=/etc/ssl/etcd/ssl/node-node1.pem --from-file /etc/ssl/etcd/ssl/node-node1-key.pem

The certificates here are the ones already verified with curl above.

  • Mounting the certificates in the Deployment
1
kubectl -n monitor edit deployments.apps prometheus-server

Add the following two sections:

1
2
3
volumeMounts:
  - mountPath: /var/run/secrets/kubernetes.io/k8s-certs/etcd/
    name: k8s-certs
1
2
3
4
volumes:
  - name: k8s-certs
    secret:
      secretName: etcd-certs
  • Adding the job that scrapes Etcd metrics in the ConfigMap
1
kubectl -n monitor edit cm prometheus-server
 1
 2
 3
 4
 5
 6
 7
 8
 9
10
11
- job_name: etcd
  metrics_path: /metrics
  scheme: https
  tls_config:
    ca_file: /var/run/secrets/kubernetes.io/k8s-certs/etcd/ca.pem
    cert_file: /var/run/secrets/kubernetes.io/k8s-certs/etcd/node-node1.pem
    key_file: /var/run/secrets/kubernetes.io/k8s-certs/etcd/node-node1-key.pem
  static_configs:
    - targets: ["1.1.1.1:2379"]
    - targets: ["2.2.2.2:2379"]
    - targets: ["3.3.3.3:2379"]
  • Checking the targets status

At this point, in Prometheus you should see the job scraping Etcd monitoring data in the Up state, as shown below:

4. Importing a Grafana Dashboard to View the Monitoring Data

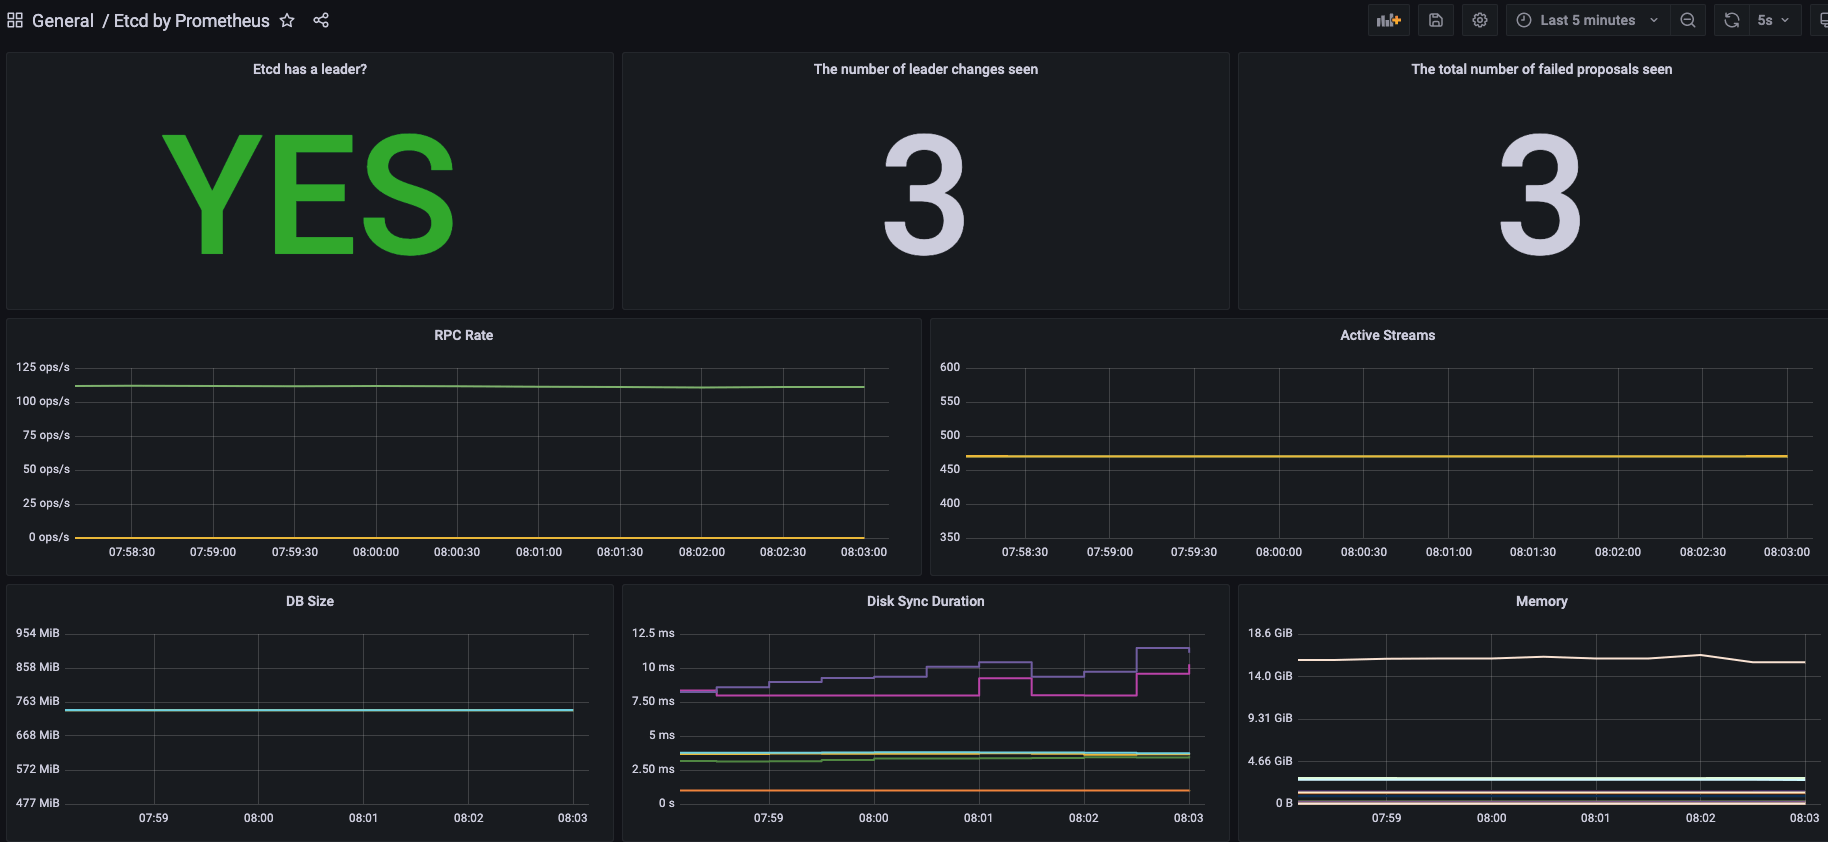
Import dashboard 3070 in Grafana, that is https://grafana.com/grafana/dashboards/3070-etcd/ , and you will see the following monitoring views:

WeChat Official Account
WRITTEN BY
WeChat Official Account