1. Why Operations Events
- Less invasive
Operations teams usually already have observations accumulated in the Metrics and Log dimensions. Operations events can be a new entry point: introduce new operational capabilities without affecting the stability of existing systems.
- Better suited to automation
Metrics represent system state, Log represents specific code behavior, while Event represents changes in components.
And change is the greatest enemy of stability. Operations events capture change better and can trigger automation.
- Faster response
The anomaly detection mechanism for Metrics and Log is scheduled queries, along with configured threshold and duration checks, so alerting carries a certain delay.
The anomaly detection mechanism for operations events is real-time listening: as soon as an event is watched, automation can be triggered immediately.
- I can offer some experience
Over the past two years I have been exploring the application of AI Agents in operations, and there are already some cases to reference. We generate 1M+ operations events every day; through various alerts and fully automated handling flows, they keep dozens of AI clusters and the AI applications on them running stably.
2. Installing the Event Components
- Install Nats
| |
- Generate nats-values.yaml
| |
- Generate nats-values.yaml
Note the storageClassName needs adjusting
| |
For multiple clusters, you can refer to https://www.chenshaowen.com/ops/zh/nats.html to configure a primary Nats cluster, with the other clusters connecting to it through leafnodes.
- Install Ops
| |
The https://github.com/shaowenchen/ops project watches all Kubernetes events, converts them into operations events, and stores them in an external Nats cluster. Confirmed through metric monitoring, the Ops project does not affect the performance of kube-apiserver or etcd. Once events are exported and stored in Nats, they put no additional pressure on Kubernetes.
3. Event Format
3.1 Namespace-Level Event Format
| |
Among them:
- {cluster}: cluster name (read from the environment variable EVENT_CLUSTER)
- {namespace}: Kubernetes namespace
- {resourceType}: resource type (such as deployments, pods, configmaps, etc.)
- {resourceName}: resource name
- {observation}: observation type, with the possible values and their meanings:
- status: resource status information (such as running state, health state, etc.)
- events: event information (such as Kubernetes events)
- alerts: alert information
- findings: proactively reported information and state
3.2 Node Event Format
| |
Among them:
- {cluster}: cluster name (read from the environment variable EVENT_CLUSTER)
- {nodeName}: node name
- {observation}: observation type, with the possible values and their meanings:
- events: event information (such as Kubernetes events)
- alerts: alert information
- findings: proactively reported information and state
Example:
| |
3.3 Notification Format
This kind of event data is not collected from Kubernetes by the Ops project; instead it is used to gather various notifications from other systems and turn them into operations events that can be handled.
Notification event subject format:
| |
- {provider}: notification provider or system name (such as ksyun, ai, etc.)
- {channel}: notification channel type (such as webhook, email, sms, etc.)
- {severity}: severity level (such as info, warning, error, critical, etc.)
Example:
| |
4. Handling Events
4.1 Triggering Notifications Directly
| |
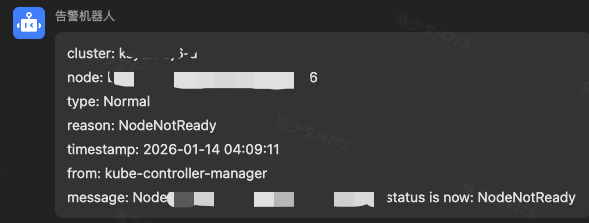
When a cluster node is not ready, a notification goes out immediately, minutes faster than a Metrics alert.
4.2 Triggering Automation Flows
| |
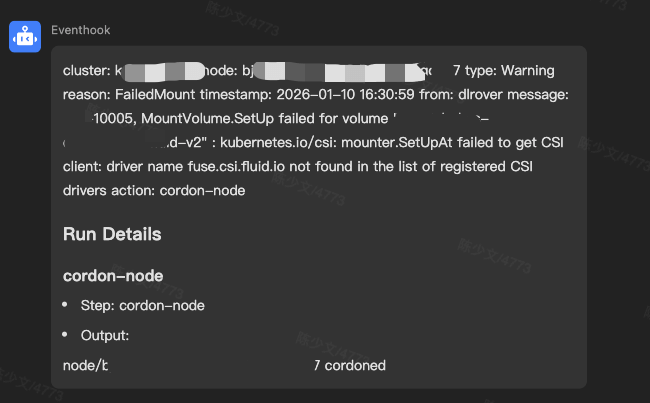
When “10005” is detected in a node event, an automation flow is triggered to perform the “cordon-node” action.
4.3 Converting Events
To make it convenient to consume events with a given characteristic, we first convert events into alert events. The exception handling module then only needs to listen for alert events.
| |
When BackOff is detected in ops.clusters.mycluster.namespaces.mynamespace.pods.myapp.events, an ops.clusters.mycluster.namespaces.mynamespace.pods.myapp.alerts event with the same content is created.
4.4 Analyzing Events
| |
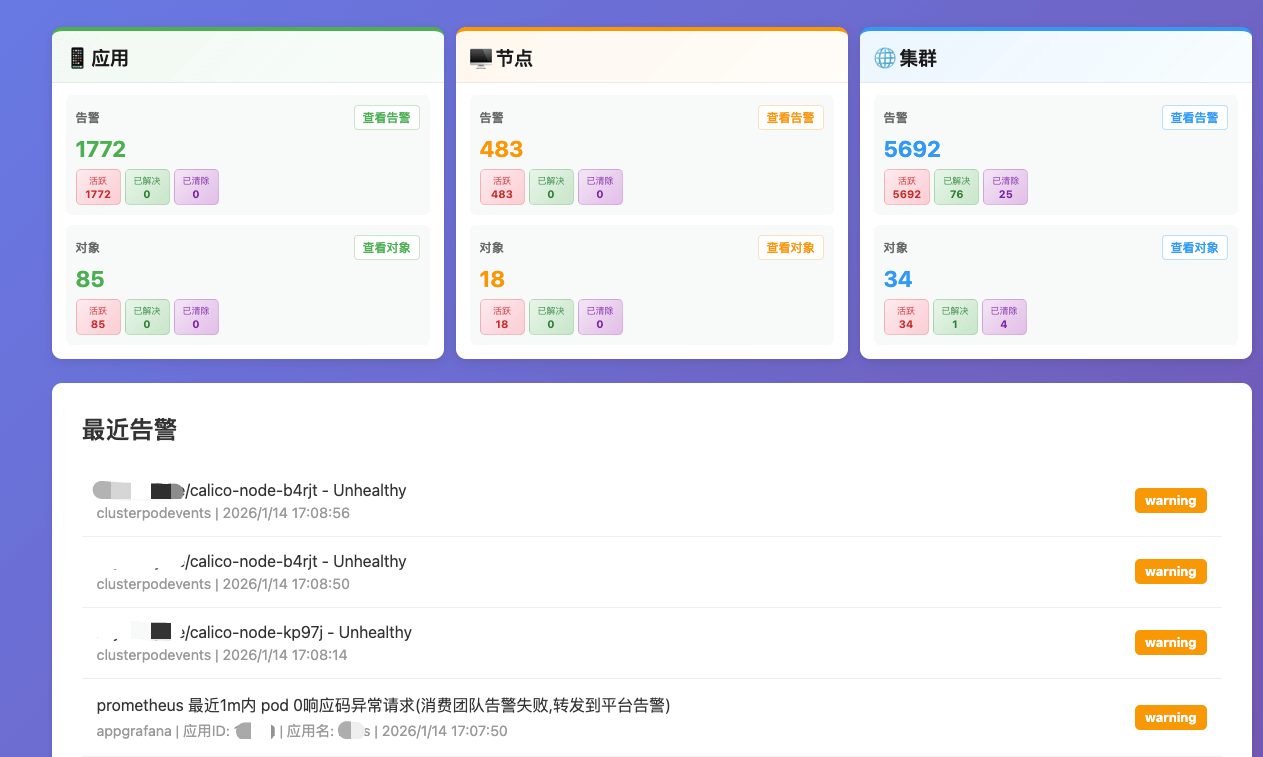
All you need to do is develop an /api/push endpoint that receives operations events and analyzes and handles them.
In our system, this endpoint already aggregates operations events from the three dimensions of applications, nodes, and clusters, for systematic analysis.
5. How to Ingest Events
5.1 Ingesting Alert Events
The https://github.com/shaowenchen/ops project provides an ops-server service that can push and consume operations events.
| |
| |
These are the event storage Topics for two cloud providers. Beyond that I have also connected an internal alert notification system, gradually improving the system event observation capability.
5.2 taskrun Scheduled Jobs
The https://github.com/shaowenchen/ops project supports scheduled jobs; you can configure taskrun to run some customized script checks and report them as findings events.
| |
In ops.clusters.*.namespaces.*.hosts.*.findings, these events will be received.
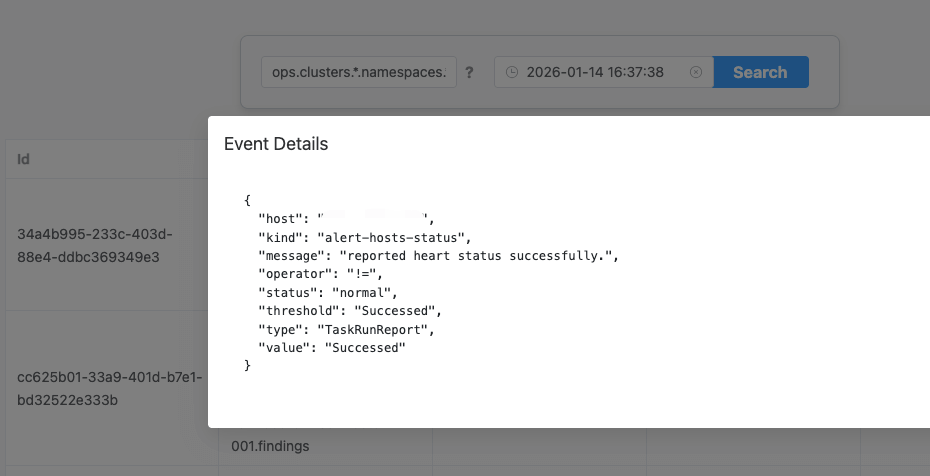
The Ops project also provides a web page for viewing these events.
6. Summary
In 2025 I did a series of optimizations in the AI Agent operations direction: stopping iteration on the previous copilot mode, introducing MCP to unify the ingestion of Metrics, Log, Event, and SOPS, structuring alert data, triggering SOPS directly, and automating SLO analysis.
The cornerstone of these automation-layer optimizations is operations events. I previously wrote Transforming the Operations System with an Event Bus explaining the important role of the event bus in an operations system, and this post is a real-world implementation of that event bus.
