If you need to monitor the network status between two hosts, or between a host and an external service, then the Blackbox Exporter mentioned in this article is worth a try.
1. Installing Blackbox
1.1 Deploying on a Host
- Download the binary package
1
2
3
4
5
| wget https://github.com/prometheus/blackbox_exporter/releases/download/v0.21.0/blackbox_exporter-0.21.0.linux-amd64.tar.gz
tar -xzvf blackbox_exporter-0.21.0.linux-amd64.tar.gz
mv blackbox_exporter-0.21.0.linux-amd64/blackbox_exporter /usr/bin/
mkdir /etc/prometheus
mv blackbox_exporter-0.21.0.linux-amd64/blackbox.yml /etc/prometheus/
|
- Clean up the installation package
1
| rm -rf blackbox_exporter-0.21.0.linux-amd64*
|
1
| vim /usr/lib/systemd/system/blackbox_exporter.service
|
Add the following content:
[Unit]
Description=blackbox_exporter
After=network.target

[Service]
Restart=on-failure
ExecStart=/usr/bin/blackbox_exporter \
    --config.file=/etc/prometheus/blackbox.yml
Restart=on-failure

[Install]
WantedBy=multi-user.target
1
2
| systemctl enable blackbox_exporter
systemctl start blackbox_exporter
|
1
| systemctl status blackbox_exporter
|
1.2 Deploying on a Cluster
Installing on Kubernetes is much simpler; just apply the Yaml below.
  1
  2
  3
  4
  5
  6
  7
  8
  9
 10
 11
 12
 13
 14
 15
 16
 17
 18
 19
 20
 21
 22
 23
 24
 25
 26
 27
 28
 29
 30
 31
 32
 33
 34
 35
 36
 37
 38
 39
 40
 41
 42
 43
 44
 45
 46
 47
 48
 49
 50
 51
 52
 53
 54
 55
 56
 57
 58
 59
 60
 61
 62
 63
 64
 65
 66
 67
 68
 69
 70
 71
 72
 73
 74
 75
 76
 77
 78
 79
 80
 81
 82
 83
 84
 85
 86
 87
 88
 89
 90
 91
 92
 93
 94
 95
 96
 97
 98
 99
100
| apiVersion: v1
kind: ConfigMap
metadata:
name: blackbox-config
namespace: kube-system
data:
blackbox.yml: |-
modules:
http_2xx:
prober: http
http:
preferred_ip_protocol: "ipv4"
http_post_2xx:
prober: http
http:
method: POST
tcp_connect:
prober: tcp
pop3s_banner:
prober: tcp
tcp:
query_response:
- expect: "^+OK"
tls: true
tls_config:
insecure_skip_verify: false
grpc:
prober: grpc
grpc:
tls: true
preferred_ip_protocol: "ip4"
grpc_plain:
prober: grpc
grpc:
tls: false
service: "service1"
ssh_banner:
prober: tcp
tcp:
query_response:
- expect: "^SSH-2.0-"
- send: "SSH-2.0-blackbox-ssh-check"
irc_banner:
prober: tcp
tcp:
query_response:
- send: "NICK prober"
- send: "USER prober prober prober :prober"
- expect: "PING :([^ ]+)"
send: "PONG ${1}"
- expect: "^:[^ ]+ 001"
icmp:
prober: icmp
---
apiVersion: apps/v1
kind: Deployment
metadata:
name: blackbox
namespace: kube-system
spec:
selector:
matchLabels:
app: blackbox
template:
metadata:
labels:
app: blackbox
spec:
hostAliases:
- ip: "0.0.0.0"
hostnames:
- "dev.chenshaowen.com"
containers:
- image: prom/blackbox-exporter:v0.21.1
name: blackbox
args:
- --config.file=/etc/blackbox_exporter/blackbox.yml
- --log.level=error
ports:
- containerPort: 9115
volumeMounts:
- name: config
mountPath: /etc/blackbox_exporter
volumes:
- name: config
configMap:
name: blackbox-config
---
apiVersion: v1
kind: Service
metadata:
name: blackbox
namespace: kube-system
spec:
selector:
app: blackbox
ports:
- port: 9115
targetPort: 9115
type: NodePort
|
2. Testing a Host’s Outbound Connectivity
blackbox_exporter exposes its service on local port 9115 by default.
In fact, by concatenating a URL we can test a host’s connectivity to any service. Here is an example: you only need to provide the target and module parameters, where target is the object to test and module is the module used for the test.
In a browser, visit http://BLACKBOX_HOST_IP:9115/probe?target=google.com&module=http_2xx, replacing BLACKBOX_HOST_IP with the host IP.
 1
 2
 3
 4
 5
 6
 7
 8
 9
10
11
12
13
14
15
16
17
18
19
20
21
22
23
24
25
26
27
28
29
30
31
32
33
34
35
36
37
38
39
40
41
42
43
| # HELP probe_dns_lookup_time_seconds Returns the time taken for probe dns lookup in seconds
# TYPE probe_dns_lookup_time_seconds gauge
probe_dns_lookup_time_seconds 0.030818323
# HELP probe_duration_seconds Returns how long the probe took to complete in seconds
# TYPE probe_duration_seconds gauge
probe_duration_seconds 0.353982702
# HELP probe_failed_due_to_regex Indicates if probe failed due to regex
# TYPE probe_failed_due_to_regex gauge
probe_failed_due_to_regex 0
# HELP probe_http_content_length Length of http content response
# TYPE probe_http_content_length gauge
probe_http_content_length -1
# HELP probe_http_duration_seconds Duration of http request by phase, summed over all redirects
# TYPE probe_http_duration_seconds gauge
probe_http_duration_seconds{phase="connect"} 0.08580119300000001
probe_http_duration_seconds{phase="processing"} 0.201979714
probe_http_duration_seconds{phase="resolve"} 0.060847821999999996
probe_http_duration_seconds{phase="tls"} 0
probe_http_duration_seconds{phase="transfer"} 0.003931112
# HELP probe_http_redirects The number of redirects
# TYPE probe_http_redirects gauge
probe_http_redirects 3
# HELP probe_http_ssl Indicates if SSL was used for the final redirect
# TYPE probe_http_ssl gauge
probe_http_ssl 0
# HELP probe_http_status_code Response HTTP status code
# TYPE probe_http_status_code gauge
probe_http_status_code 200
# HELP probe_http_uncompressed_body_length Length of uncompressed response body
# TYPE probe_http_uncompressed_body_length gauge
probe_http_uncompressed_body_length 13645
# HELP probe_http_version Returns the version of HTTP of the probe response
# TYPE probe_http_version gauge
probe_http_version 1.1
# HELP probe_ip_addr_hash Specifies the hash of IP address. It's useful to detect if the IP address changes.
# TYPE probe_ip_addr_hash gauge
probe_ip_addr_hash 4.032438981e+09
# HELP probe_ip_protocol Specifies whether probe ip protocol is IP4 or IP6
# TYPE probe_ip_protocol gauge
probe_ip_protocol 4
# HELP probe_success Displays whether or not the probe was a success
# TYPE probe_success gauge
probe_success 1
|
The comments give a very detailed description of these metrics: DNS latency, response, protocol, and so on.
3. Prometheus Configuration
Next, we can have Prometheus scrape blackbox’s metrics on a schedule. Below is the relevant configuration file; replace BLACKBOX_HOST_IP with the IP address of the host where blackbox_exporter is deployed.
 1
 2
 3
 4
 5
 6
 7
 8
 9
10
11
12
13
14
15
16
17
18
19
20
21
22
23
24
25
26
27
28
29
30
31
32
33
| scrape_configs:
- job_name: "blackbox_http"
metrics_path: /probe
params:
module: [http_2xx]
static_configs:
- targets: ["github.com"]
labels:
url: "github.com"
- targets: ["dl-cdn.alpinelinux.org"]
labels:
url: "dl-cdn.alpinelinux.org"
relabel_configs:
- source_labels: [__address__]
target_label: __param_target
- target_label: __address__
replacement: BLACKBOX_HOST_IP:9115
- job_name: "blackbox_icmp"
metrics_path: /probe
params:
module: [icmp]
static_configs:
- targets: ["github.com"]
labels:
url: "github.com"
- targets: ["dl-cdn.alpinelinux.org"]
labels:
url: "dl-cdn.alpinelinux.org"
relabel_configs:
- source_labels: [__address__]
target_label: __param_target
- target_label: __address__
replacement: BLACKBOX_HOST_IP:9115
|
4. Configuring the Grafana Dashboard
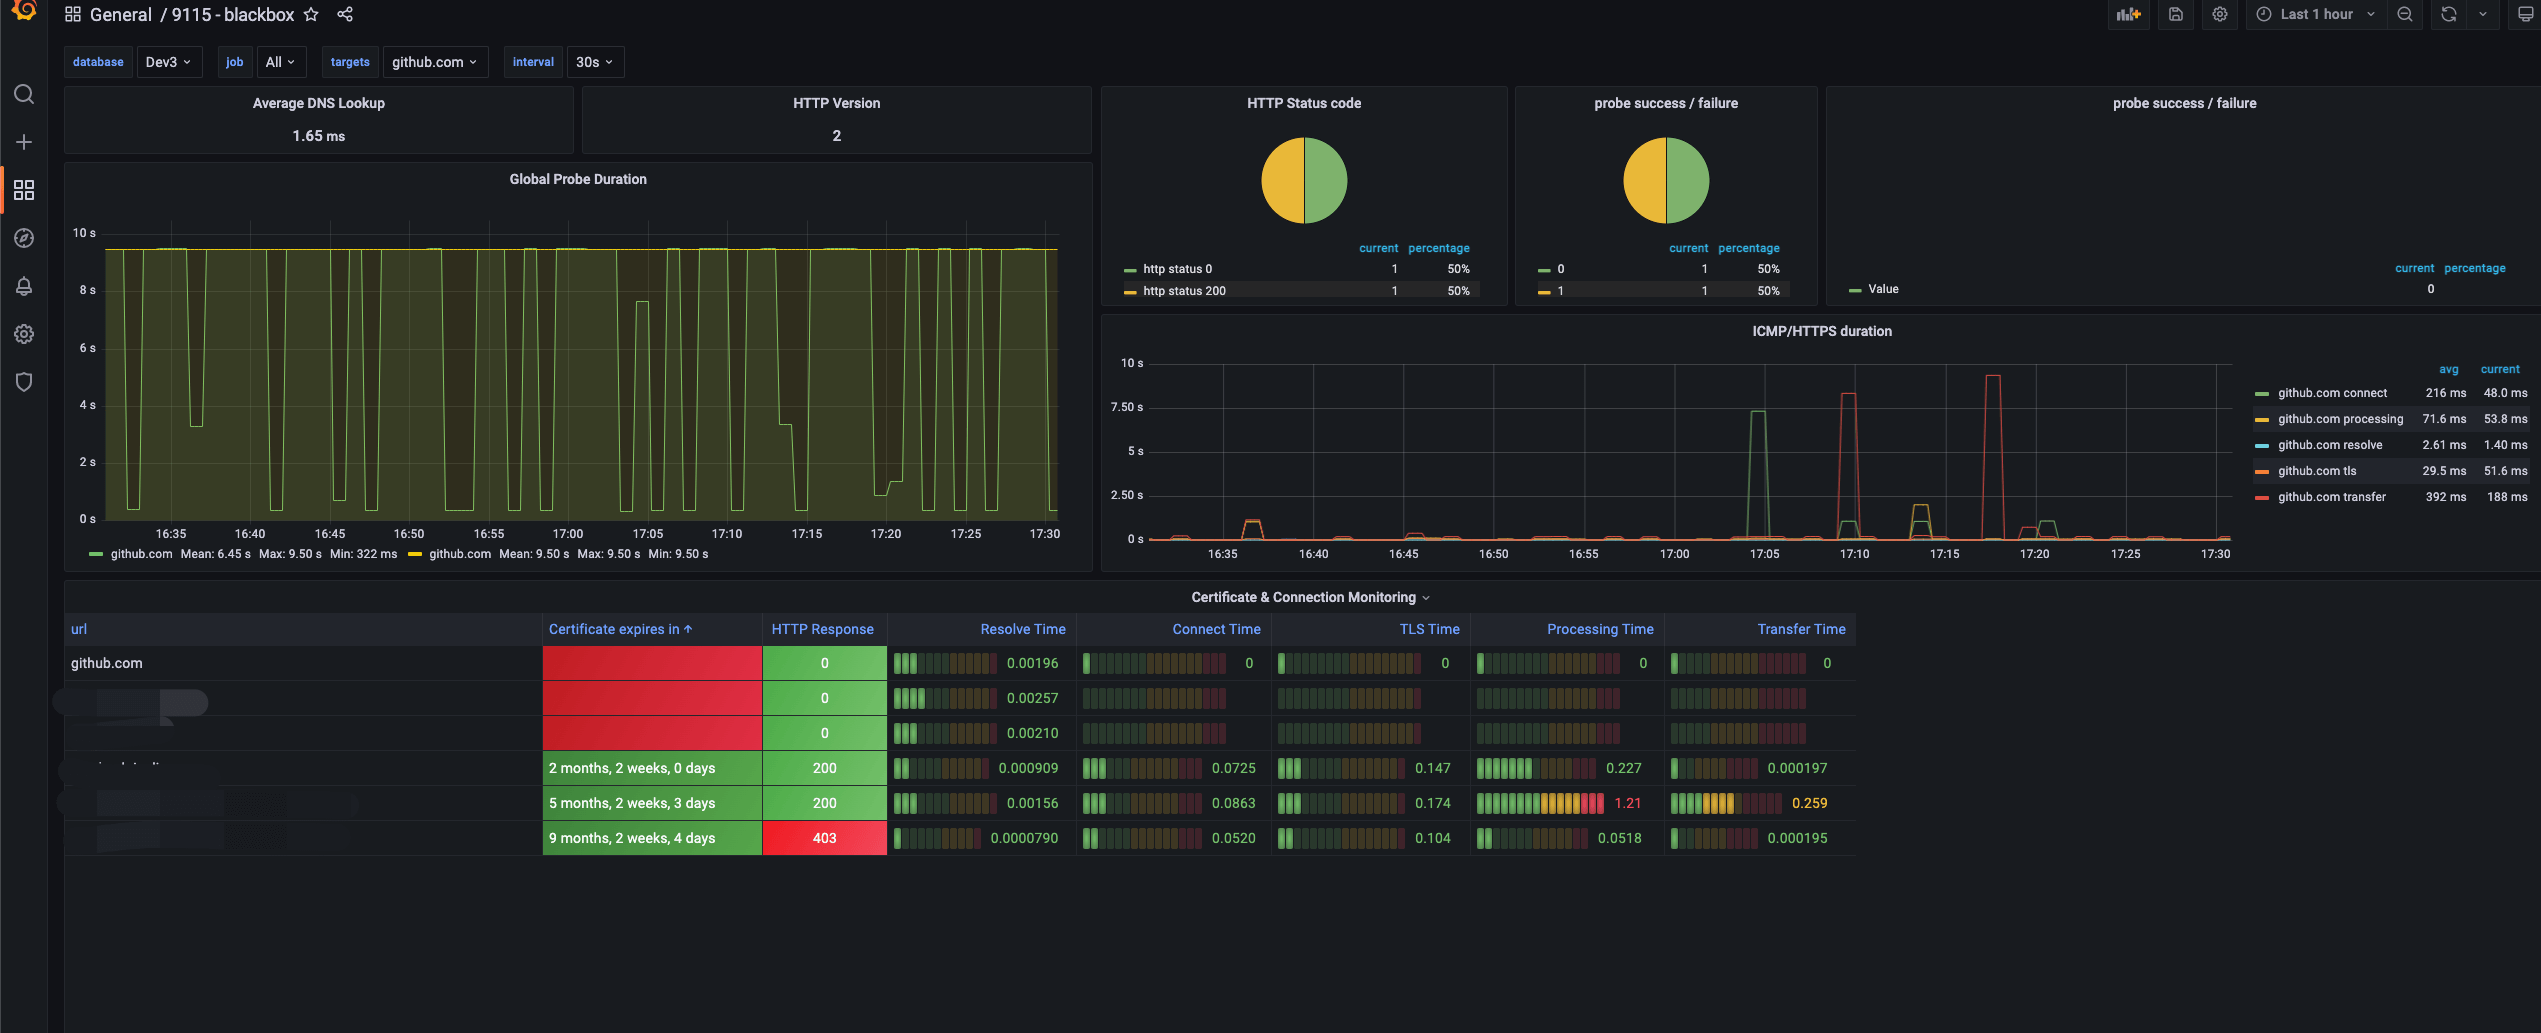
This uses the dashboard at https://grafana.com/grafana/dashboards/13587.
After some slight adjustments, it finally looks like the following:
5. Possible Issues
5.1 probe_http_status_code Is Always 0
blackbox_exporter uses the ipv6 stack by default; you need to specify ipv4 manually.
Edit the configuration file /etc/prometheus/blackbox.yml to specify the ipv4 stack.
1
2
3
4
5
| modules:
http_2xx:
prober: http
http:
preferred_ip_protocol: "ipv4"
|
Then restart the service:
1
| systemctl restart blackbox_exporter
|
5.2 Grafana Cannot Find grafana-piechart-panel
1
| grafana-cli plugins install grafana-piechart-panel
|
- Specify the plugin path in the configuration file
vim /usr/local/grafana/conf/defaults.ini

[plugin.piechart]
path = /var/lib/grafana/plugins/grafana-piechart-panel
1
| systemctl restart grafana-server
|
