1. Alerting on Kubernetes Cluster Events
- Monitor specified keywords
| |
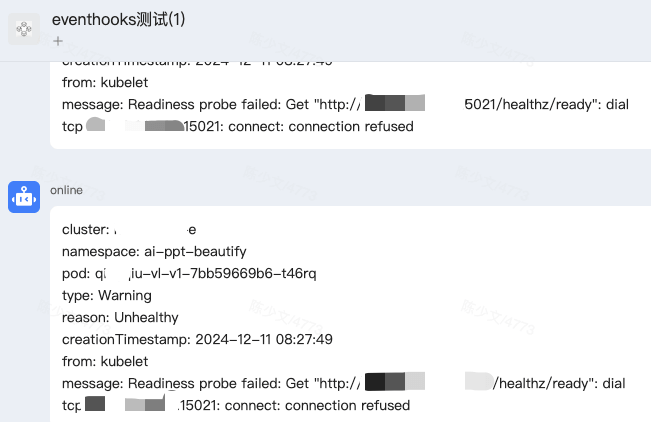
A simple configuration like this yields a large number of related alerts.
- After monitoring, handle things automatically
| |
Drawing on the execution capability of Ops Copilot, you only need to add an Action to the relevant alert and throw it to Copilot to get automated handling.
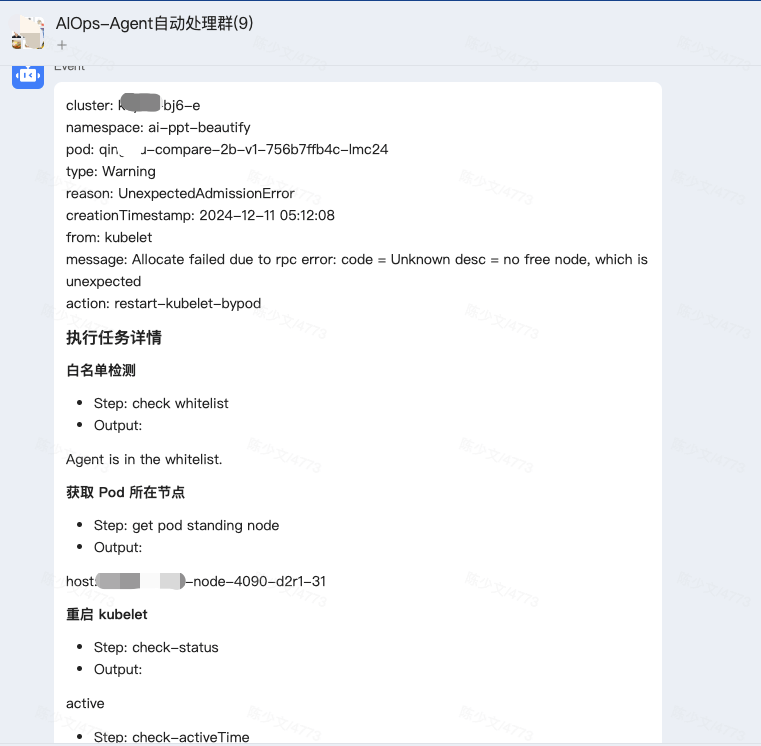
The figure above is about automatically restarting a node’s Kubelet to restore node availability under certain abnormal conditions.
2. Observing Events with Ops
The Ops project’s Server integrates a UI where you can view all events.
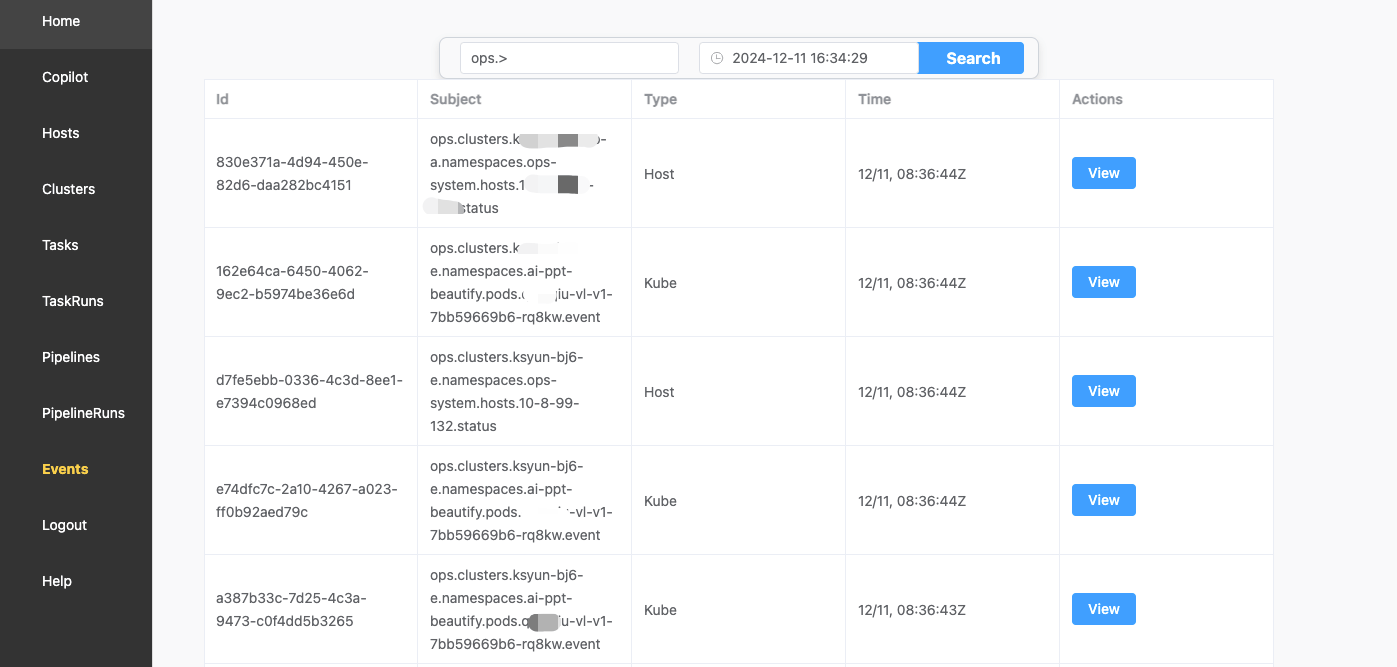
Three forms of event queries are supported:
- Direct query
| |
- Wildcard
| |
reports are events actively reported by Ops inspections, another major category besides automatically collected cluster events.
- Prefix matching
| |
Here we define the concept of an event object: the object described by a set of related event sequences, such as a Pod, a node, an application, a person’s operation, and so on.
In Nats, different events are mainly distinguished by Subjects; Nats supports up to 16 domains and a length of 256 characters.
Therefore, in Ops one event object corresponds to one Subject, expressed through a RESTful-style Subject name.
| |
3. How to Install and Use the Event Capability of Ops
Detailed installation documentation is available at https://www.chenshaowen.com/ops/zh/opscontroller.html.
- Add the Helm repository
| |
- Install ops-controller-manager
| |
Install Ops version 2.0.0; note that 2.0.0 is the next Release version and is still under development.
- Check the installation result
| |
4. About the Notification Types Supported
Currently only two are supported:
- xiezuo
- webhook
Of course, adding various notification types is quick — you can submit an issue at https://github.com/shaowenchen/ops/issues. If the test conditions are met, it can be released the same day.
Adding a new notification type does not require changing the CRD structure; you only need to update the Controller image.
5. It Does Not Put Extra Pressure on kube-apiserver
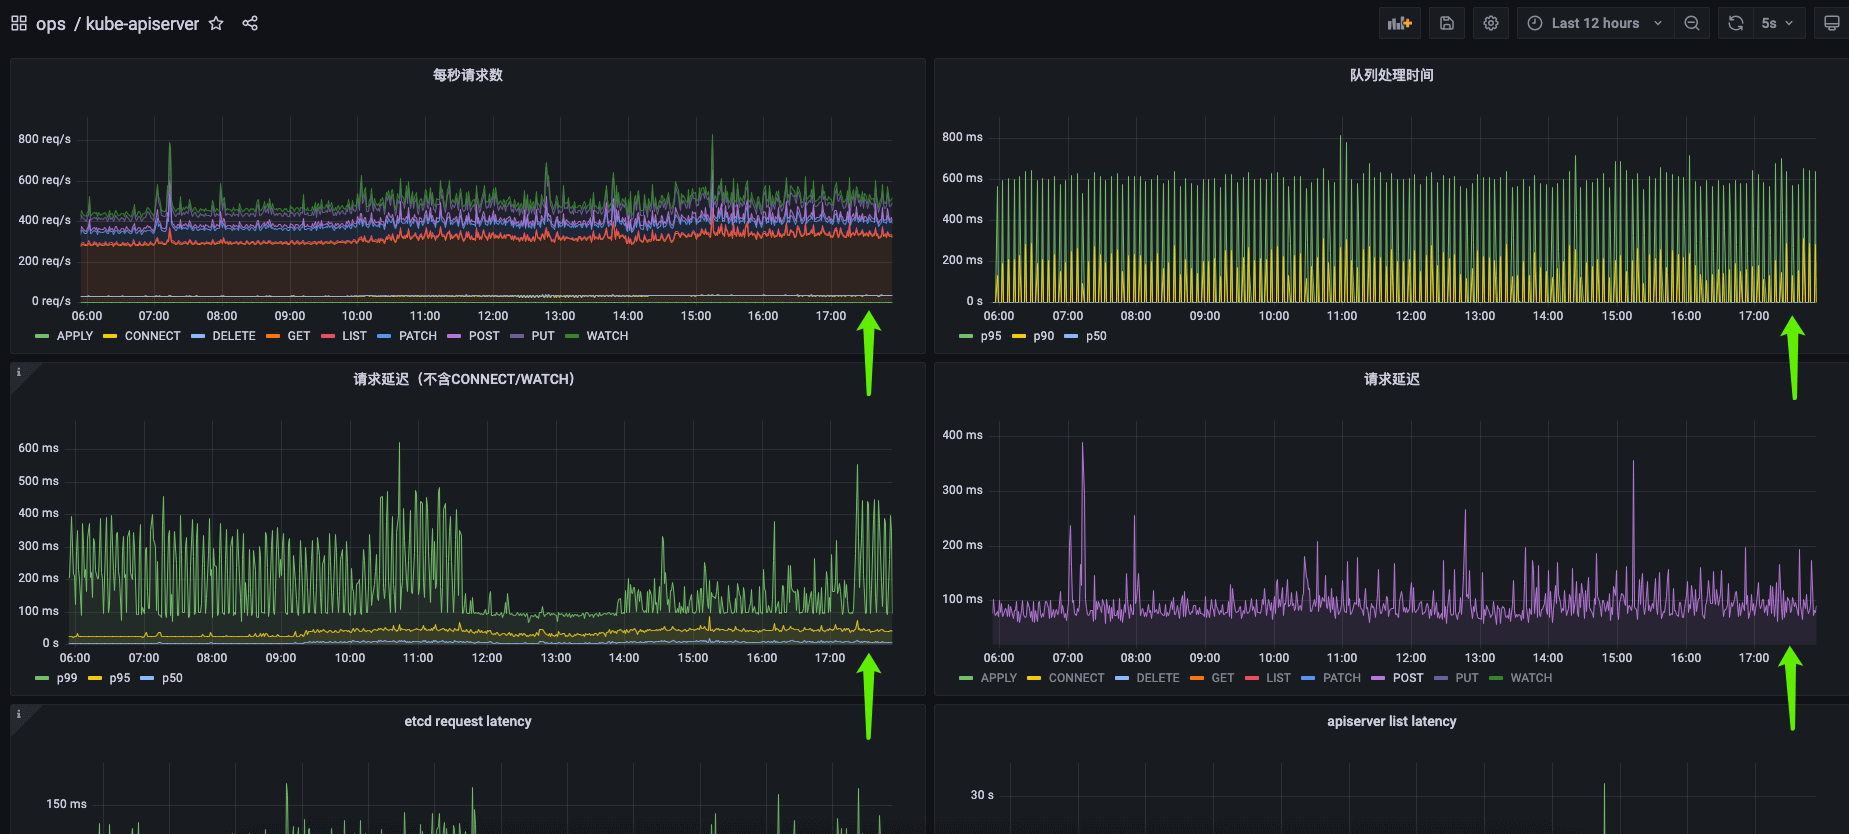
As the figure above shows, after collecting cluster Events, the kube-apiserver metrics show no noticeable deterioration, with fluctuations within the daily range, so it is safe to use.
