In the previous document, we took advantage of the elasticity Kubernetes provides to dynamically create Jenkins Slaves on Kubernetes. This document is mainly a stress test of Jenkins under large-scale builds.
1. Cluster Configuration
1.1 Kubernetes Version
The version used here is v1.16.7
| |
1.2 Number of Nodes
The cluster has 16 nodes in total.
| |
Of these, there are 3 master nodes and 13 worker nodes.
| |
| |
1.3 CI Nodes
Ten of these nodes are selected for CI builds: five with 8 cores and 32 G, and five with 16 cores and 32 G. These nodes are given the Label node-role.kubernetes.io/worker=ci, which build Pods use to select a Node, so as to avoid affecting other workloads on the cluster.
| |
1.4 CI Resource Configuration
- Pod count limit, enough to support 1100 Pods
According to the official documentation, Kubernetes supports up to 5000 nodes and 150,000 Pods.
| |
Besides the cap on the total number of Pods in the cluster, what is relevant here is the kubelet’s limit on the maximum number of pods.
| |
Ten CI nodes can provide 1100 Pods in total, which is already enough after subtracting the pods taken up by some system components.
- Memory and CPU, enough to support 400 concurrent pipelines
Each Pod uses roughly 500 MB of Memory. CPU is an instantaneous value that runs relatively high during a build, but it stays there only briefly, so it does not need much consideration here. Five 8-core 32 G nodes and five 16-core 32 G nodes give a total of 120 cores and 320 G of memory, enough to support 400 (> 320 * 0.8 / 0.5 = 512) pipelines building at the same time. In addition, since the Jenkins Agent Pod is configured with soft affinity, when CI nodes run short of resources the Pod can also be scheduled to other nodes.
2. Jenkins Configuration
2.1 Jenkins
Even though pipelines execute on Agents, a large number of pipelines running at the same time still puts pressure on Jenkins. Here the limit for Jenkins is 8 cores and 16 GB, that is, the maximum amount of resources it is allowed to consume.
Jenkins is deployed with Helm and runs on Kubernetes. Below is an excerpt of part of the Deployment information:
| |
2.2 Jenkins Agent
Dynamic Pods provided by Kubernetes are used as Jenkins Agents to build pipelines; for the specific configuration, refer to the document link at the top.
The main contents of the Dockerfile for the Maven container image in the Pod are as follows:
Dockerfile
| |
To reduce the impact on other nodes, soft affinity is configured in Jenkins so that the dynamic Pods it creates are scheduled to the designated CI nodes as much as possible.
| |
2.4 Kubernetes Plugin Configuration in Jenkins
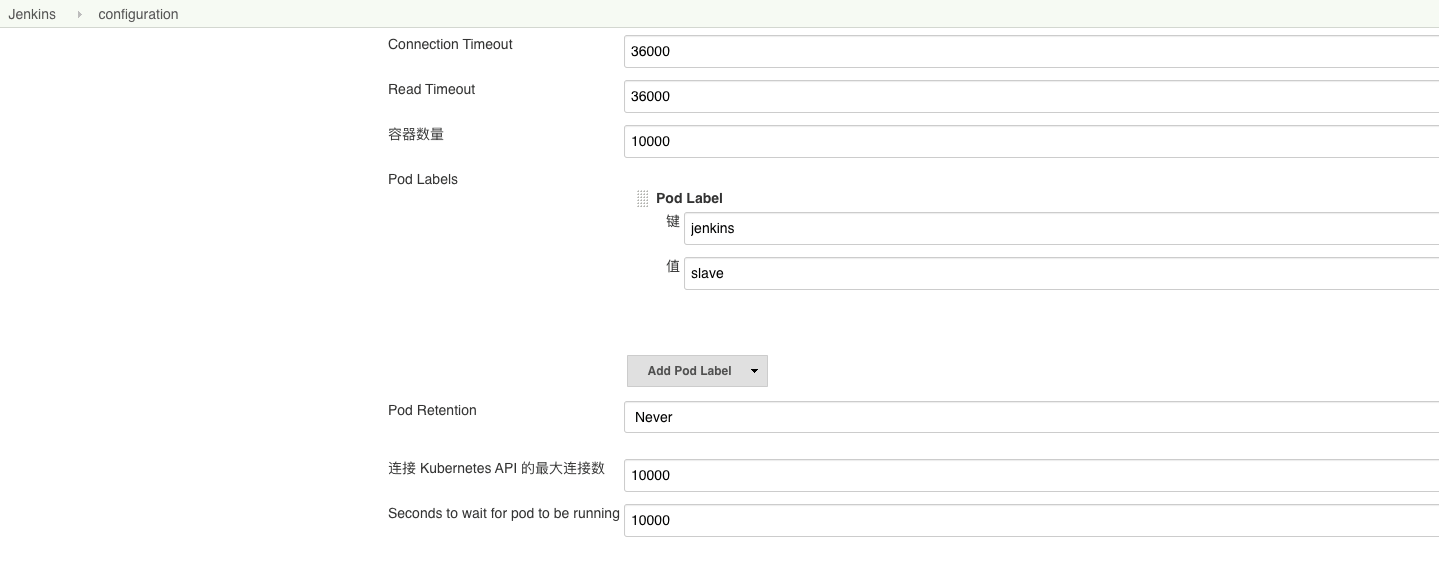
Set the number of containers and the waiting time to a relatively large value.
2.5 Pipeline Demo Used for Testing
The demo uses a Java project: clone the code, run unit tests, and build an image. Since the image contents are all the same, the image is not pushed here, which also reduces external dependencies. gitee.com also rate-limits pulls, so it is recommended to use a code repository you have set up yourself.
| |
2.6 Script for Remotely Triggering Pipelines
| |
3. Test Strategy
To better test the performance of Jenkins executing pipelines on Kubernetes, in the configuration above I provided enough resources for 400 pipelines to execute concurrently.
Because the first run of a pipeline needs to pull images and cache dependency packages, before running the test I ran the pipeline 20 times to warm up the nodes.
Five groups of tests were run, with 50, 100, 200, 400, and 800 concurrent pipelines respectively.
Metrics observed
- Trigger success rate
- Whether the Jenkins UI opens normally
- The speed at which Jenkins creates Pods
- Pipeline execution success rate
- The reason for failures
4. Test Results
| Concurrent Pipelines | Trigger Success Rate | UI Opens Normally | Time for All Pods to Be Created | Pipeline Execution Success Rate | Reason for Failure |
|---|---|---|---|---|---|
| 50 | 50/50 | Yes | 12 minutes | 50/50 | - |
| 100 | 100/100 | Yes | 7 minutes | 100/100 | - |
| 200 | 200/200 | Loads in 4 s | 7 minutes | 178/200 | Gitee rate-limited pulls |
| 400 | 400/400 | Loads in 11 s | 21 minutes | 348/400 | Gitee rate-limited pulls |
| 800 | 778/800 | Loads in 17 s | 18 minutes | 446/800 | Trigger failures; pipelines piled up and could not be scheduled |
Below are the specific monitoring data and analysis
- 50 concurrent
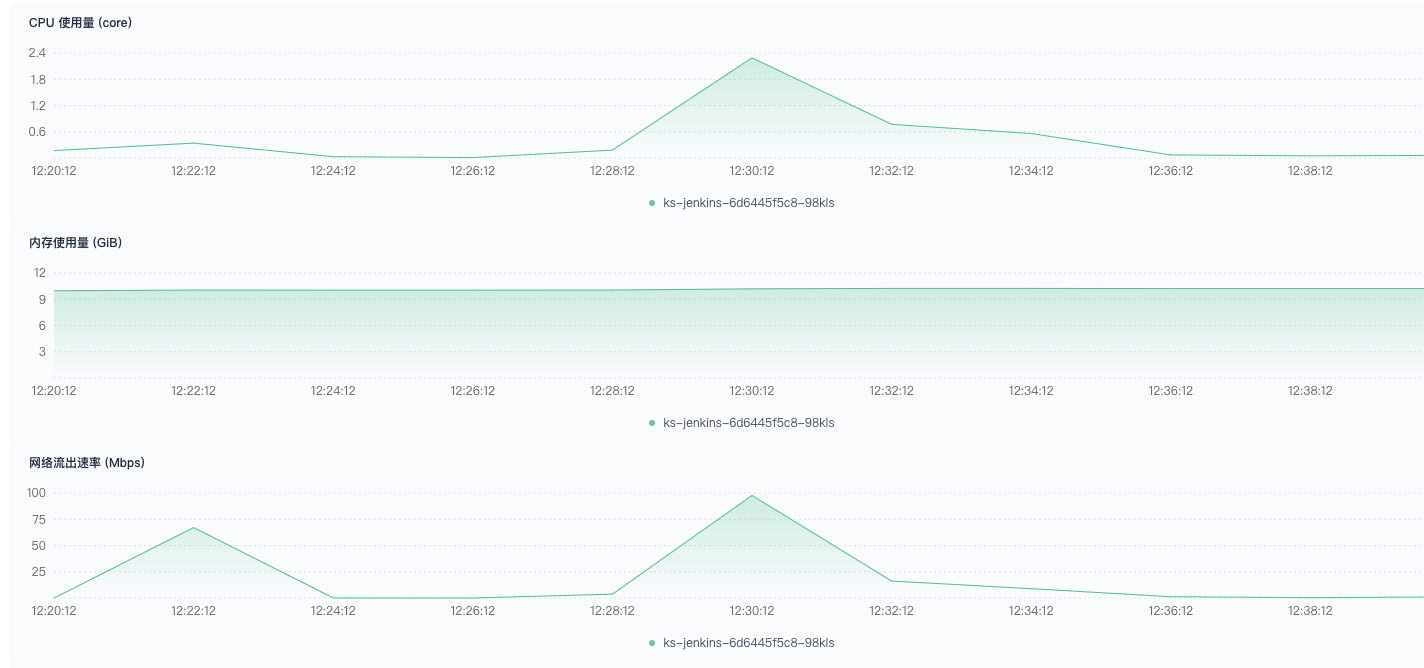
It ran normally, but the warm-up was probably not sufficient: it slowed down in the latter half and creation took longer.



- 100 concurrent
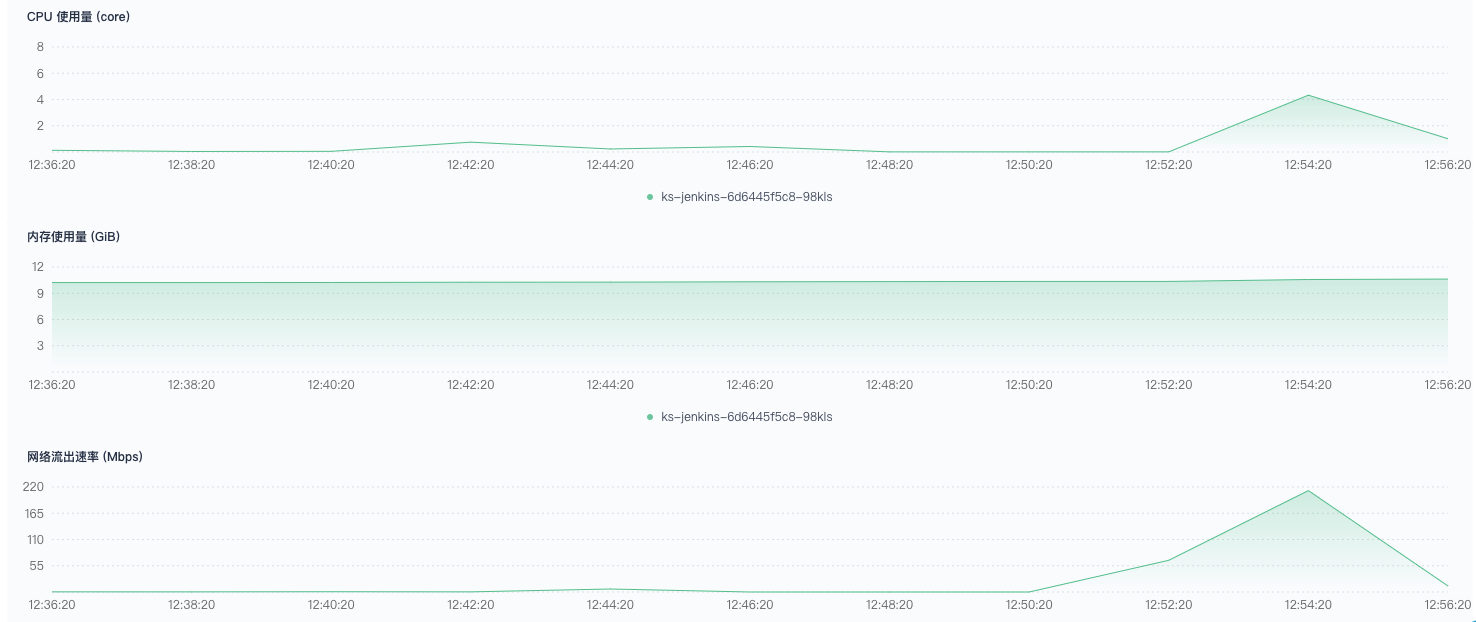
It ran normally, and Pods were created very quickly, one every 3~4 seconds


- 200 concurrent
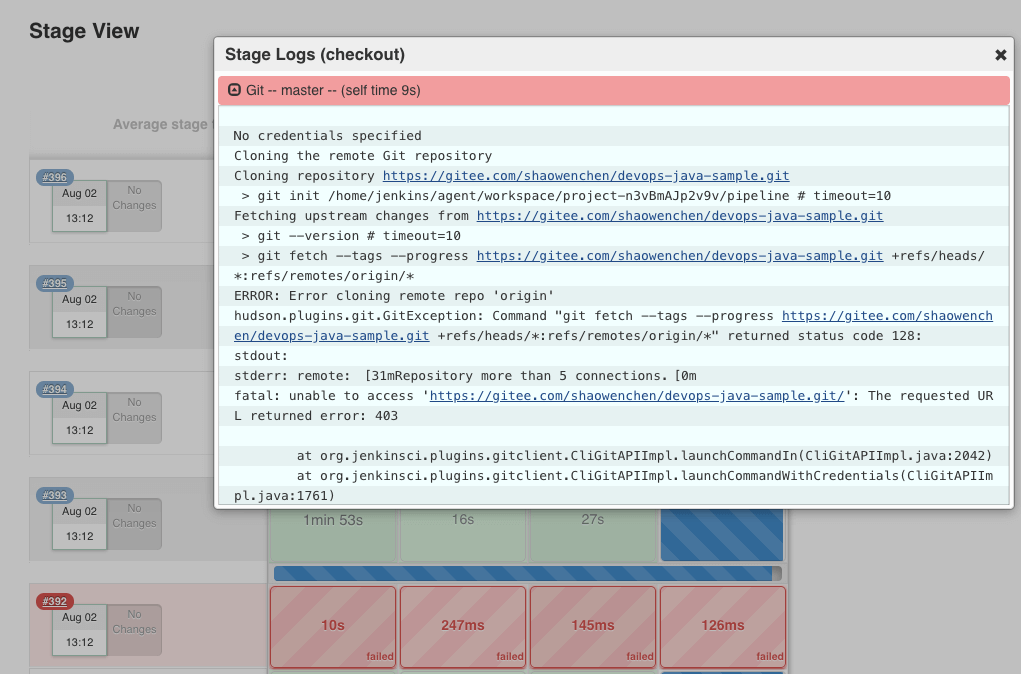
Triggering was normal, but some pipelines reported errors during execution. These errors were mainly caused by rate limits when pulling code from the git server. The error message is as follows:


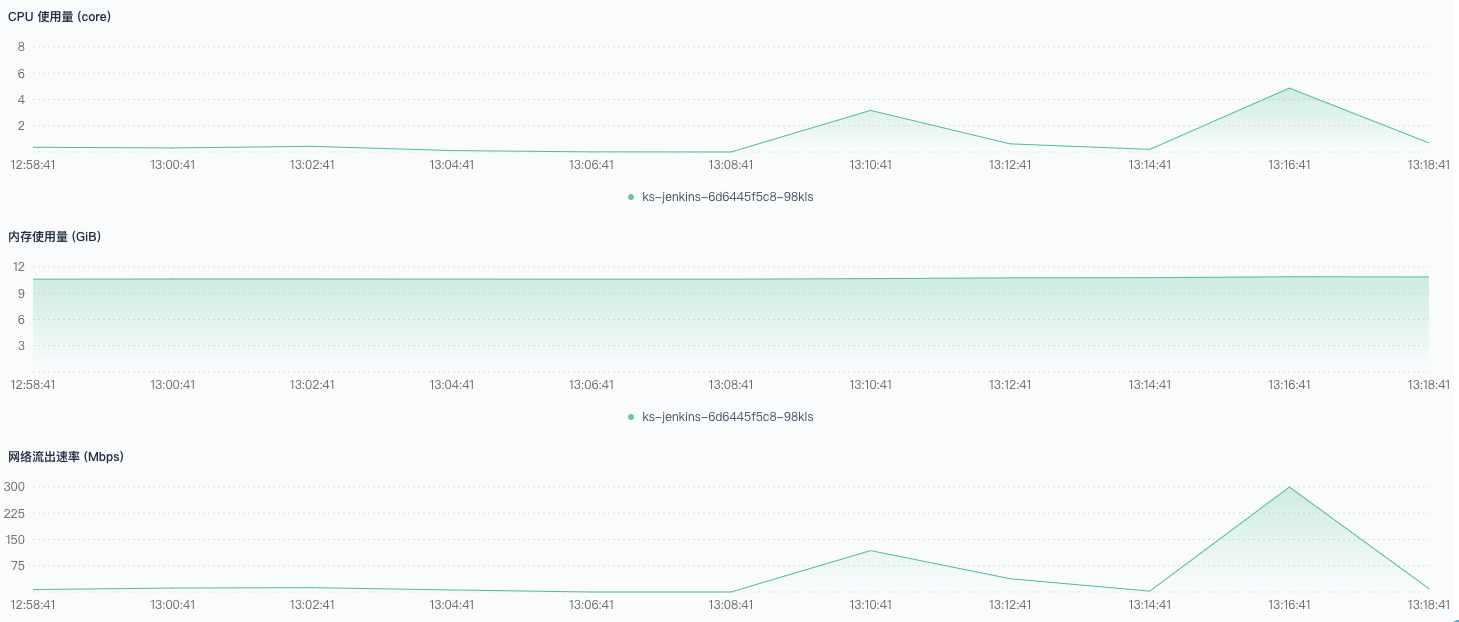
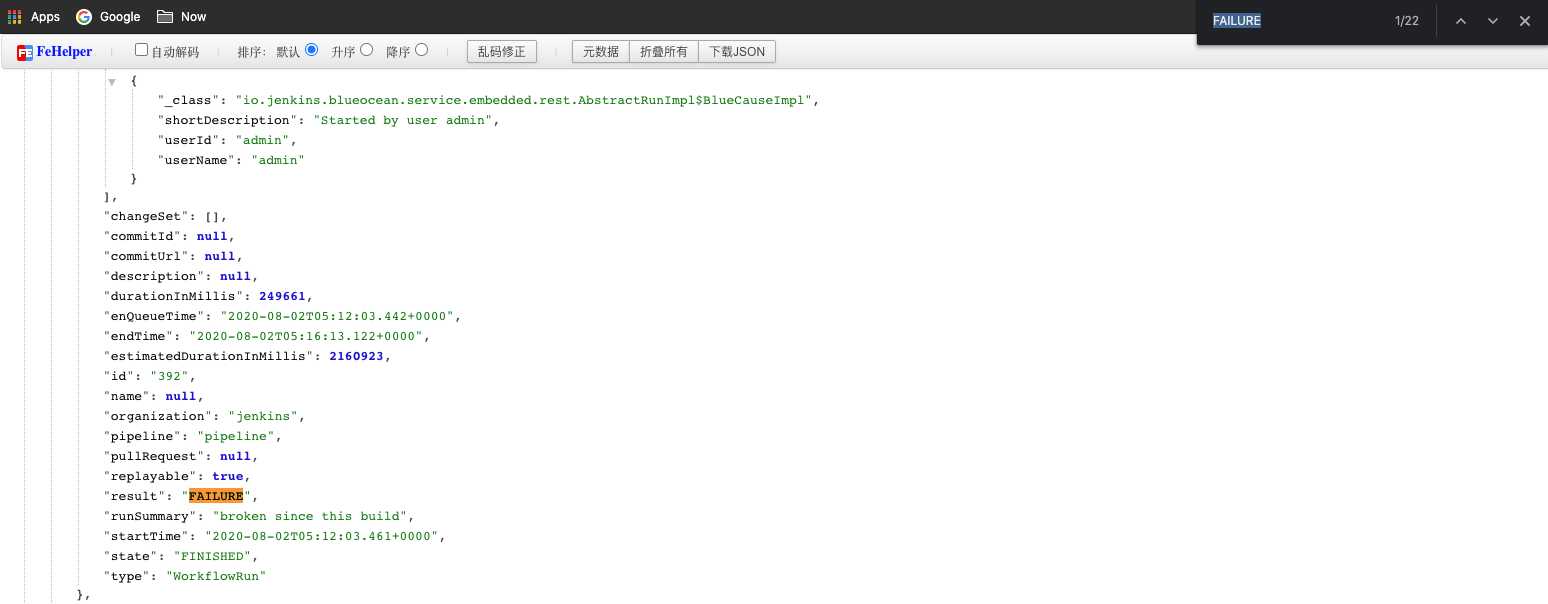
- 400 concurrent
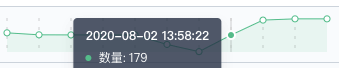
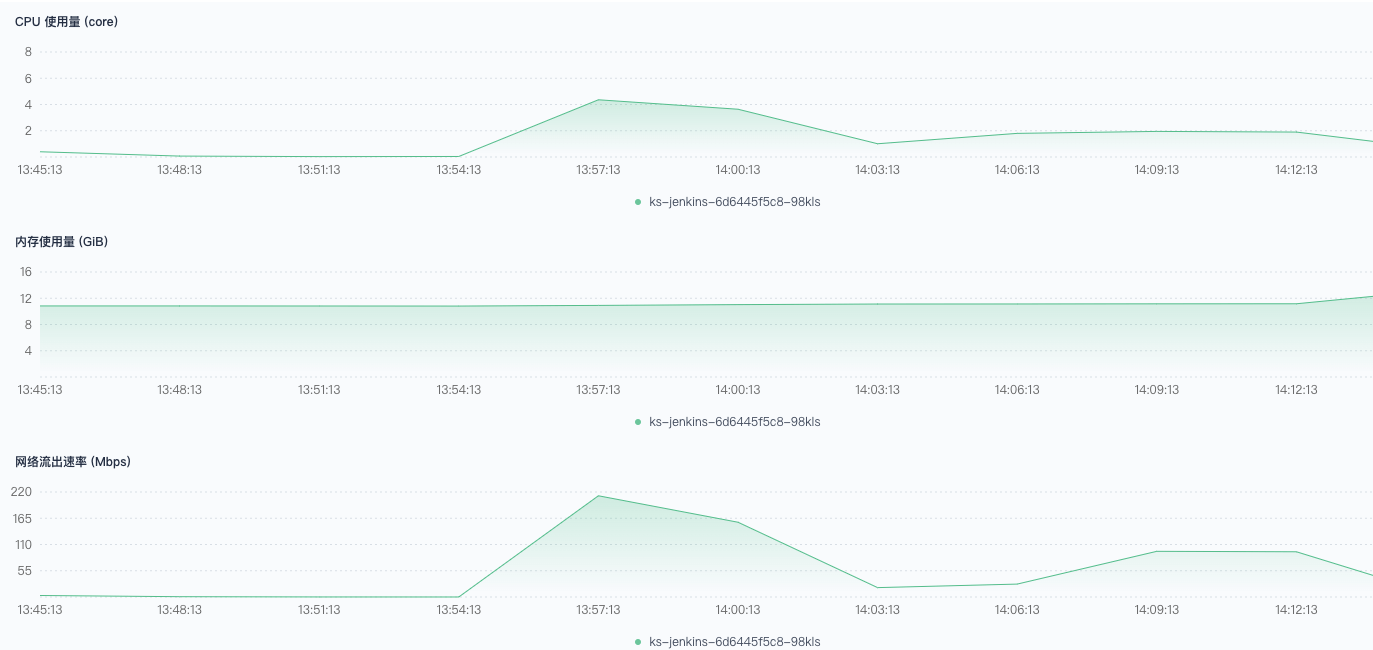
A very small number were scheduled to non-CI nodes, and there were likewise a large number of errors when pulling code from the git server.



- 800 concurrent
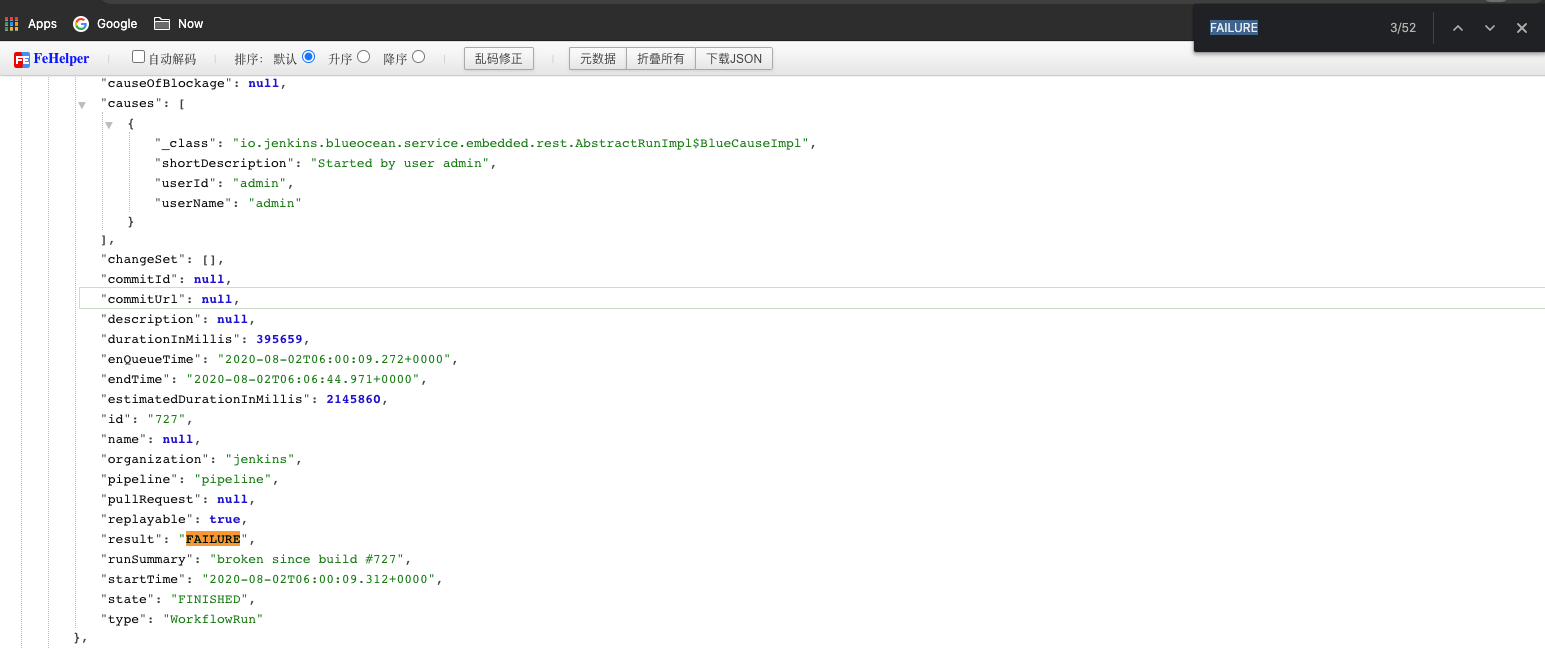
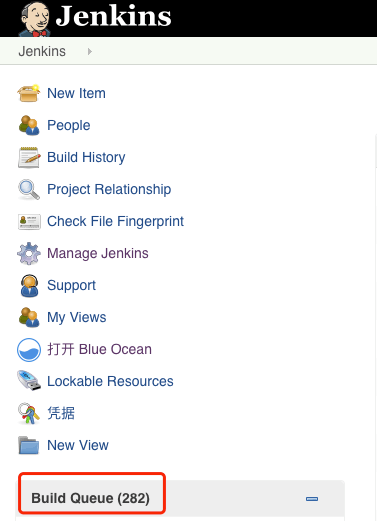
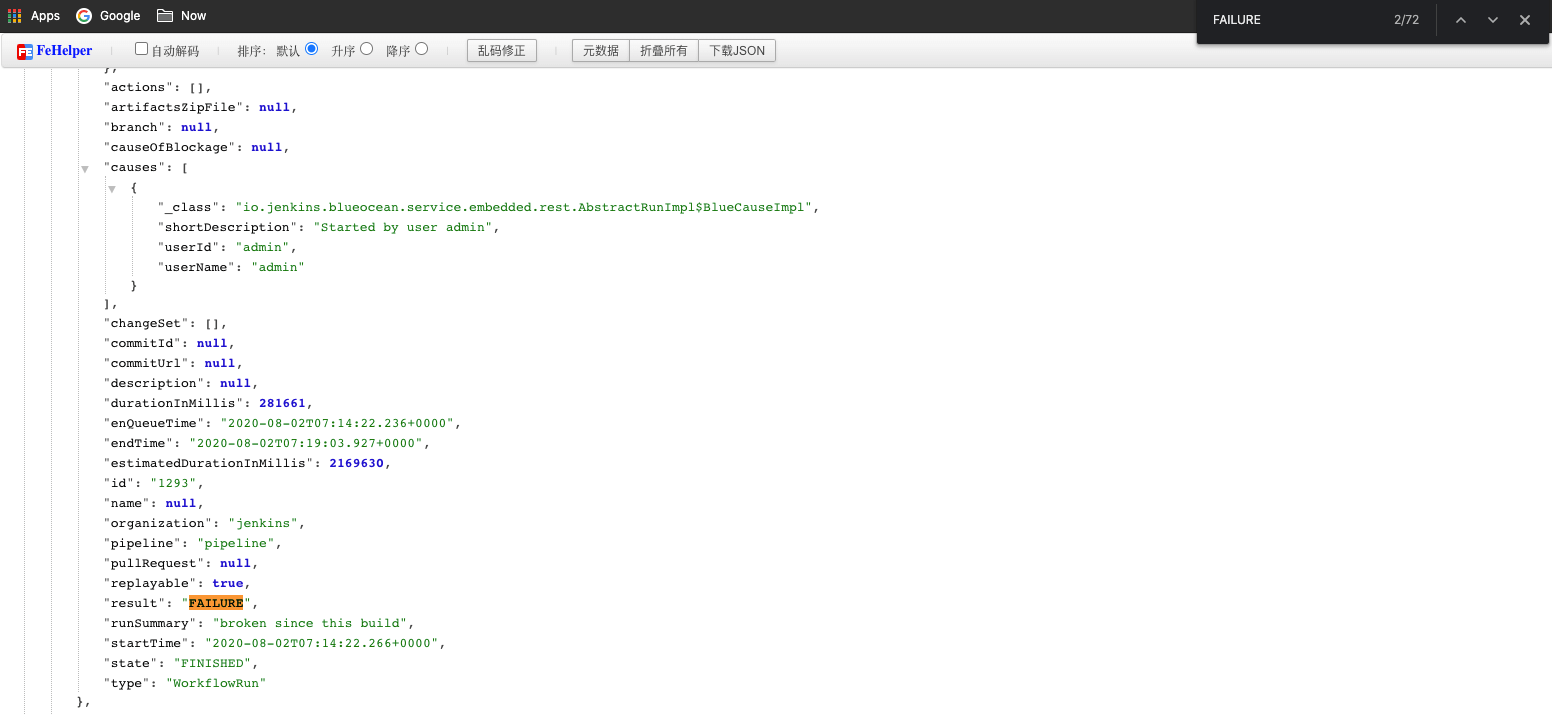
460, 461, 551, 552, and 759-776 failed to trigger. A small number were scheduled to non-CI nodes, and a large number of pipelines piled up in the Build Queue; these pipelines were not scheduled for a long time, and restarting Jenkins still did not get them to execute.




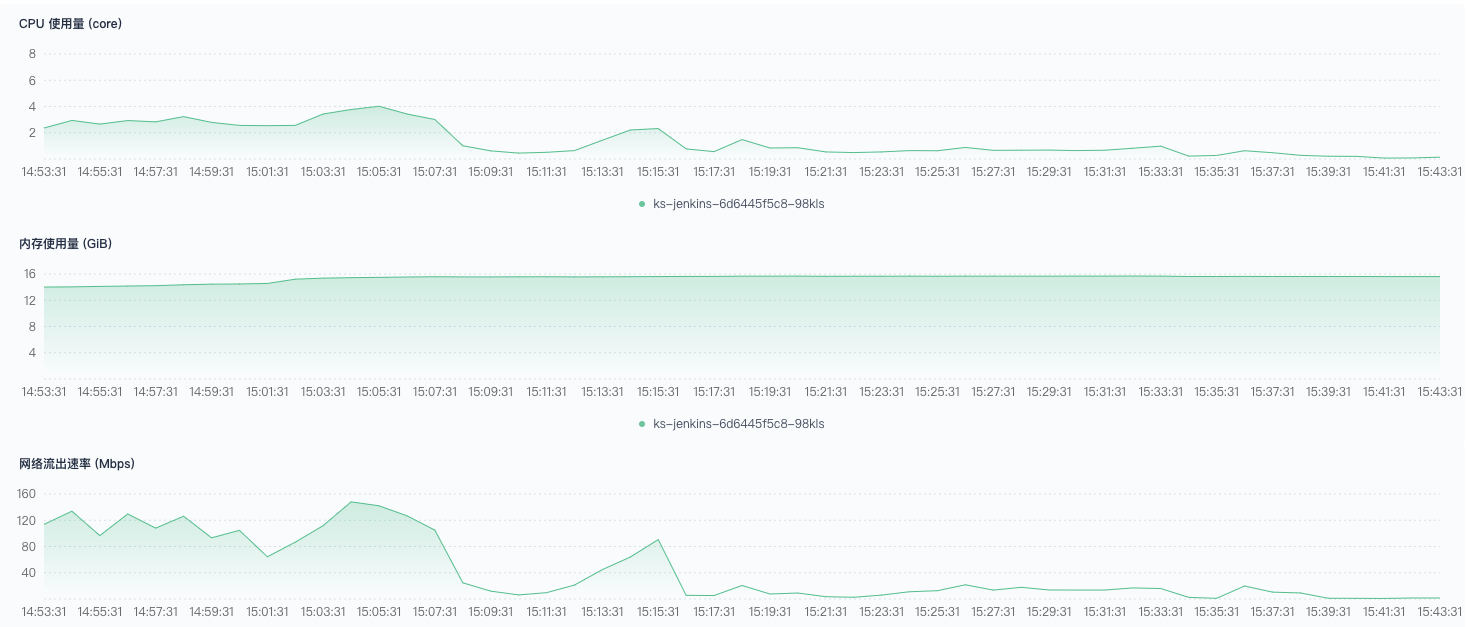
800 concurrent pipelines exceeded the cluster’s load limit. The memory Jenkins used reached its limit, and the number of jnlp connections it could manage also reached its limit. The relevant error messages are as follows:
| |
The -XX:MaxRAM=16g configuration was clearly strained at 400 concurrent pipelines, and by 800 it was no longer enough. Afterwards I set the maximum memory usage to 32 g and tested again: the trigger success rate improved somewhat but still did not reach 100%; Pod creation became faster, and even when cluster resources were sufficient, some pipelines were still stuck in the Build Queue and could not be scheduled.
Later, I found a cluster with 202 nodes for testing, with the Jenkins memory limit set very large. Trigger requests were sent continuously through the API, and the number of Pods peaked at 517 (=520-3); the jnlp in the Pods had problems connecting to Jenkins. At the same time, this was accompanied by a large number of trigger and build errors. The figure below shows the Pod count monitoring:

5. Test Summary and Recommendations
In principle, what the Jenkins Kubernetes plugin does is call the Kubernetes API to create Pods for builds. The created Pod contains jnlp and the container for the actual build environment.
In high-concurrency, high-load scenarios, the bottleneck appears in the following areas:
- The API that Jenkins provides
- Jenkins’s scheduling algorithm
- The Kubernetes API that Jenkins calls
- The speed at which Kubernetes schedules and creates Pods
- The runtime resource consumption of Pods: CPU, Mem, IO, etc.
- Jenkins’s Mem and CPU limits
This test was not particularly thorough and has the following problems:
- Insufficient warm-up. The data for the 50-concurrent test is clearly problematic: creation was even slower than at 100 concurrent, which indicates that some nodes did not have the relevant images or cache.
- Insufficient Jenkins memory. At 400 concurrent pipelines, Jenkins memory usage was already close to the limit and pages opened slowly.
Configuration recommendations:
- Limit the number of Pods Jenkins connects to at the same time. Given sufficient configuration, 200 concurrent pipelines are no problem, and 400 is worth striving for. Jenkins needs to communicate with the jnlp in every Pod, so controlling the concurrency level effectively lightens the burden on Jenkins and avoids trigger failures.
- Use dedicated CI nodes. Letting pipeline Pods drift freely between nodes and fully enjoying the elasticity Kubernetes provides is all very well, but a large number of concurrent pipelines will squeeze out the workloads on those nodes and make other applications unstable.
- Build Pods need an appropriate request set. As with creating application workloads, too small a request leads to the problem that scheduling succeeds but the Pod cannot start. With many concurrent pipelines, too small a request may directly crush a node.
- Sufficient Jenkins memory: 16 G basically guarantees system stability, and 4C or more of CPU is enough. Java applications use a lot of memory. Allocating sufficient memory to Jenkins improves the trigger success rate and the efficiency of Pod creation, and makes Jenkins more stable, so the Jenkins UI is less likely to fail to open.
- Bind a dedicated node to run Jenkins. When a large memory limit is set for Jenkins, memory usage gradually increases as concurrency rises; although the limit is large, the node’s memory may not be enough, and this may cause Jenkins to be scheduled to another node.
- Use a single-instance Jenkins. Jenkins stores its data in disk files, and multiple instances will confuse Jenkins. The error message is as follows:
| |
