1. Background
When you are at a job, you always have to do something, and you want to do something new. But it is not the case that if you want to do it you get the chance, and can do it well.
Whether you do it alone or can do it together with everyone else, the final result is different. This comes down to timing, and whether everyone can agree on the motivation.
This year is a year of cost reduction and efficiency improvement; many companies are laying off staff and cutting configurations to lower costs. As a result, there is demand for a summary of the load on the entire online service, and for fine-grained monitoring data.
For compliance reasons, the architecture of overseas services is partitioned and data is managed in a distributed way; previously it was hard to imagine centralizing the data. But now there is a solution to this need.
In some internal systems, the current monitoring system cannot be integrated programmatically, and it is impossible to present monitoring-related data by composing URLs according to rules.
For end users, if monitoring can match the business shape and let people quickly find the monitoring data related to a business, that brings enormous convenience to the business.
Whether from the company’s expected background or from our own standardization needs, this is an opportunity whose time has come and which is worth trying to push forward.
2. Topology of Overseas Services
For overseas services, we need to choose regions to deploy services in according to our business development strategy. For example, if we plan to do business in Europe, we need to choose the cloud services provided by Huawei, AWS, and other cloud vendors in that region as our infrastructure. For globally oriented business, we need to build service nodes in many regions, including Singapore, Japan, India, and the US West. Because of the data protection regulations in each region, local data is not allowed to be transmitted to other regions, so data and services can only be localized.
Each region is an independent unit that provides services externally, with its own data storage, K8s cluster, API gateway, and so on. This kind of partitioned service topology brings great challenges to operations, since changes have to be made region by region. In the post Global Image Distribution Network, I described the global operations network built across regions. As shown below:
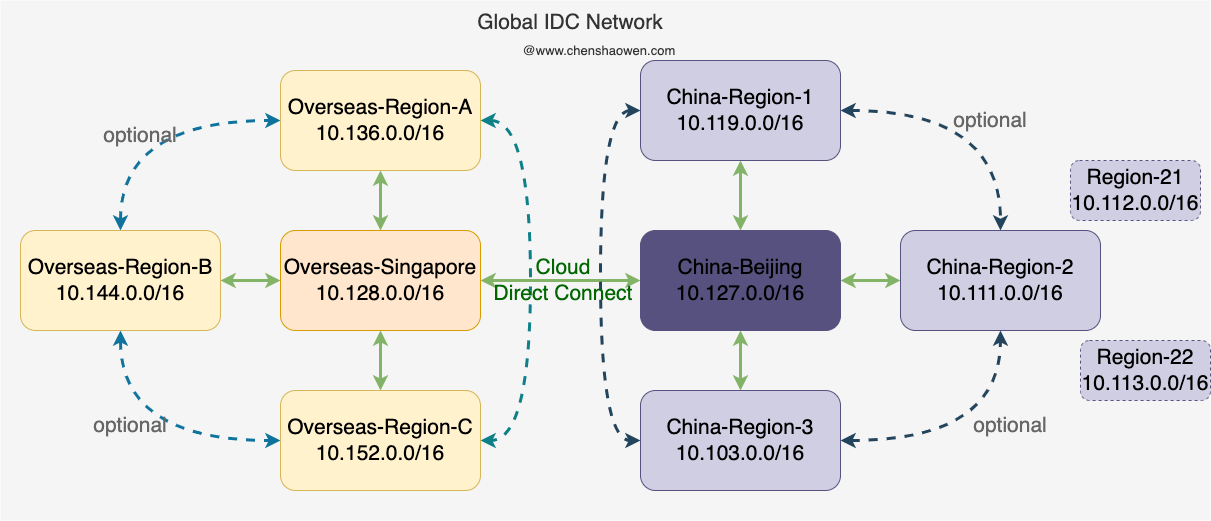
Based on the public network, building an enterprise intranet through software such as StrongVPN and WireGuard makes it possible to control all regions from one central region. This control includes application release, traffic control, image distribution, monitoring and alerting across all regions, and so on.
After getting the intranet of all regions connected, we went on to adjust monitoring in three aspects: basic resource monitoring, Kubernetes monitoring, and business data monitoring. Basic resources and Kubernetes belong to short-cycle monitoring data, while business data belongs to long-cycle monitoring data. For short-cycle monitoring data, we need to add enough labels to make filtering and querying convenient for business people, and using Prometheus for monitoring is sufficient. For long-cycle monitoring data, we adopted the Thanos solution, to avoid Prometheus bringing down cloud hosts when querying long-cycle data.
3. Basic Monitoring
In each region there is only one Prometheus pulling the monitoring data of all basic resources; these basic resources include cloud hosts, Redis, MySQL, and other middleware. Here is the Prometheus configuration:
| |
| |
file_sd_configs specifies the directory in which Prometheus discovers services automatically, and refresh_interval specifies how often Prometheus reloads the configuration files. When a new service needs monitoring added, we only need to modify the resource list of the corresponding type. Now let’s look at the definition of the resource list:
| |
| |
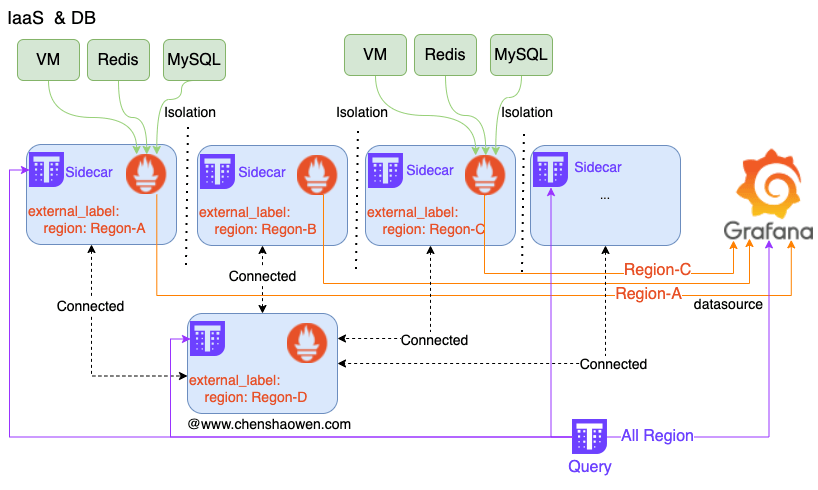
As shown below, each region has one Prometheus pulling monitoring data, and in the central region Thanos Query aggregates all the monitoring data to provide the ability to query monitoring data across all regions.
In the end, two panels need to be presented in Grafana: one is a summary of resources, the other is the details of resources. The figure below is the basic resource summary panel:
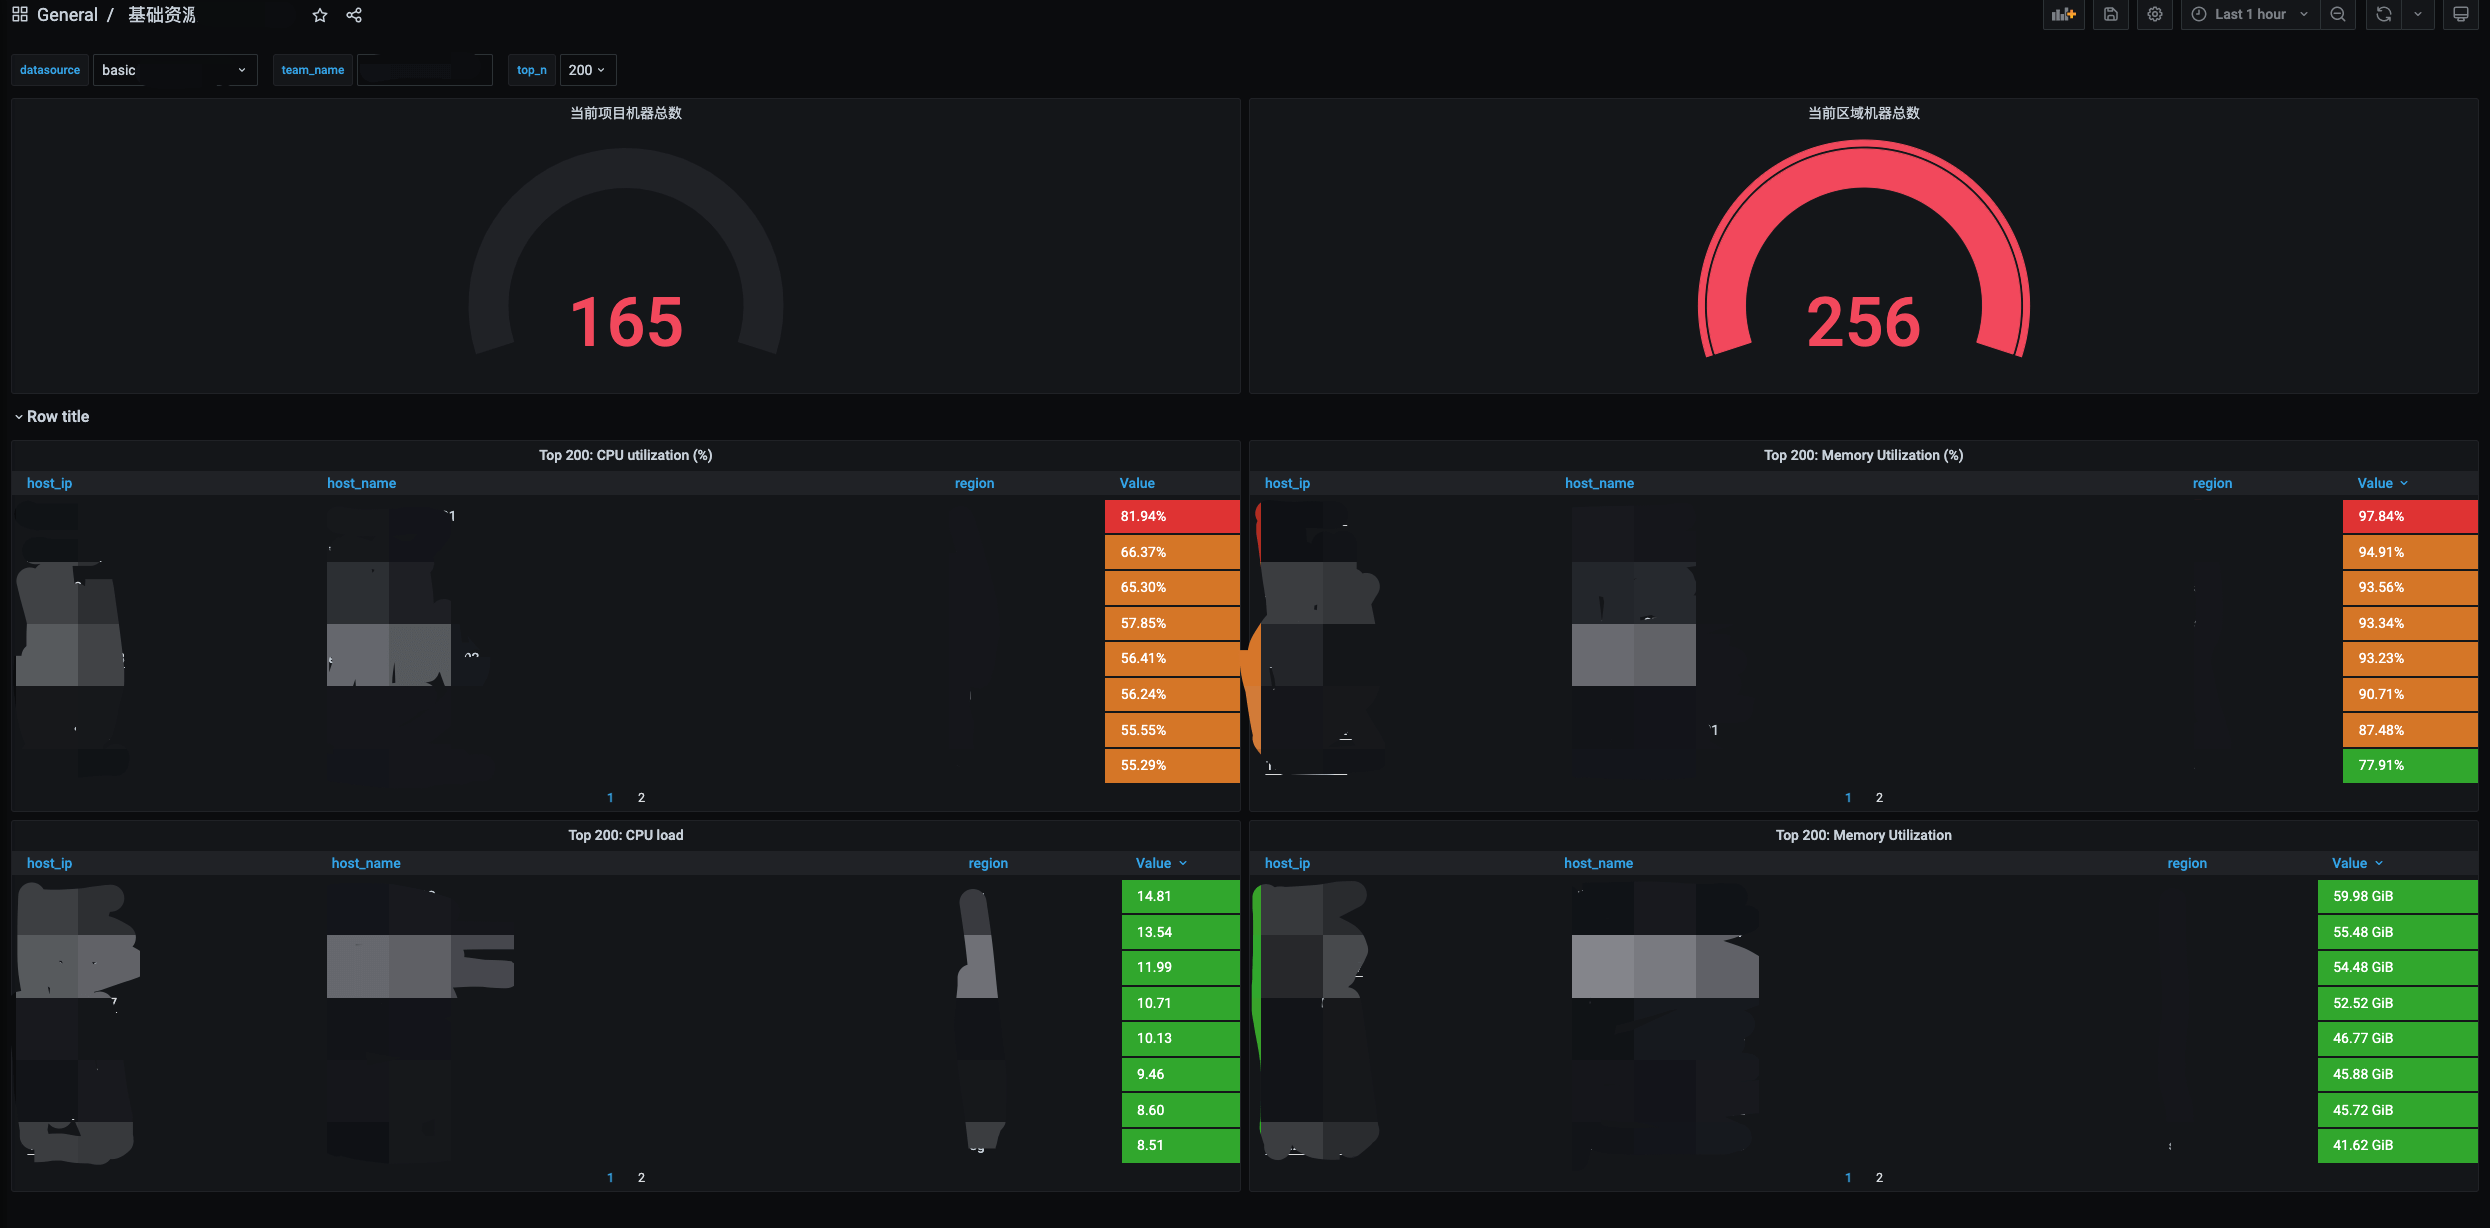
Through the summary panel, we can know how many resources a given region has and the load of each resource. Through Thanos Query aggregating the data sources, we can know the overview of resources across all regions.
4. Kubernetes Monitoring
For Kubernetes monitoring, the deployment strategy we adopted is to install one Prometheus per cluster that stores only 3d of data and does not persist it. In each region we deploy one Thanos Query to aggregate the monitoring data of all Kubernetes clusters. The figure below is the related topology:
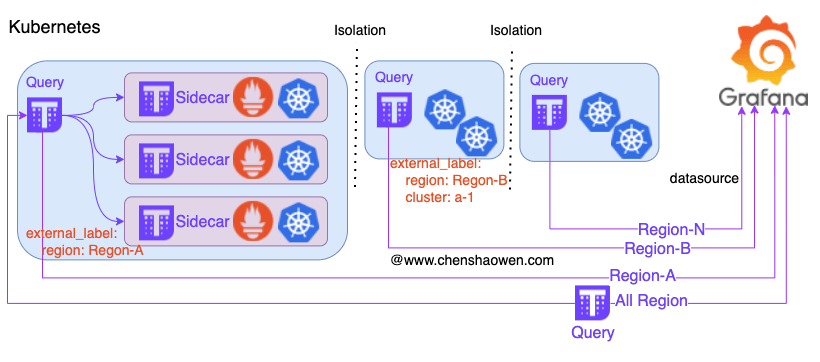
Based on the community Prometheus Helm Chart package, we added a Thanos Sidecar, repackaged it, and pushed it to the internal Harbor image registry. When adding a cluster, only two steps are needed:
- Install Prometheus
| |
Note here that external_labels.cluster gives each Kubernetes cluster a unique name.
- Add a query API in Thanos Query
You can refer to the earlier document Centralized Management of Multiple Prometheus Instances with Thanos
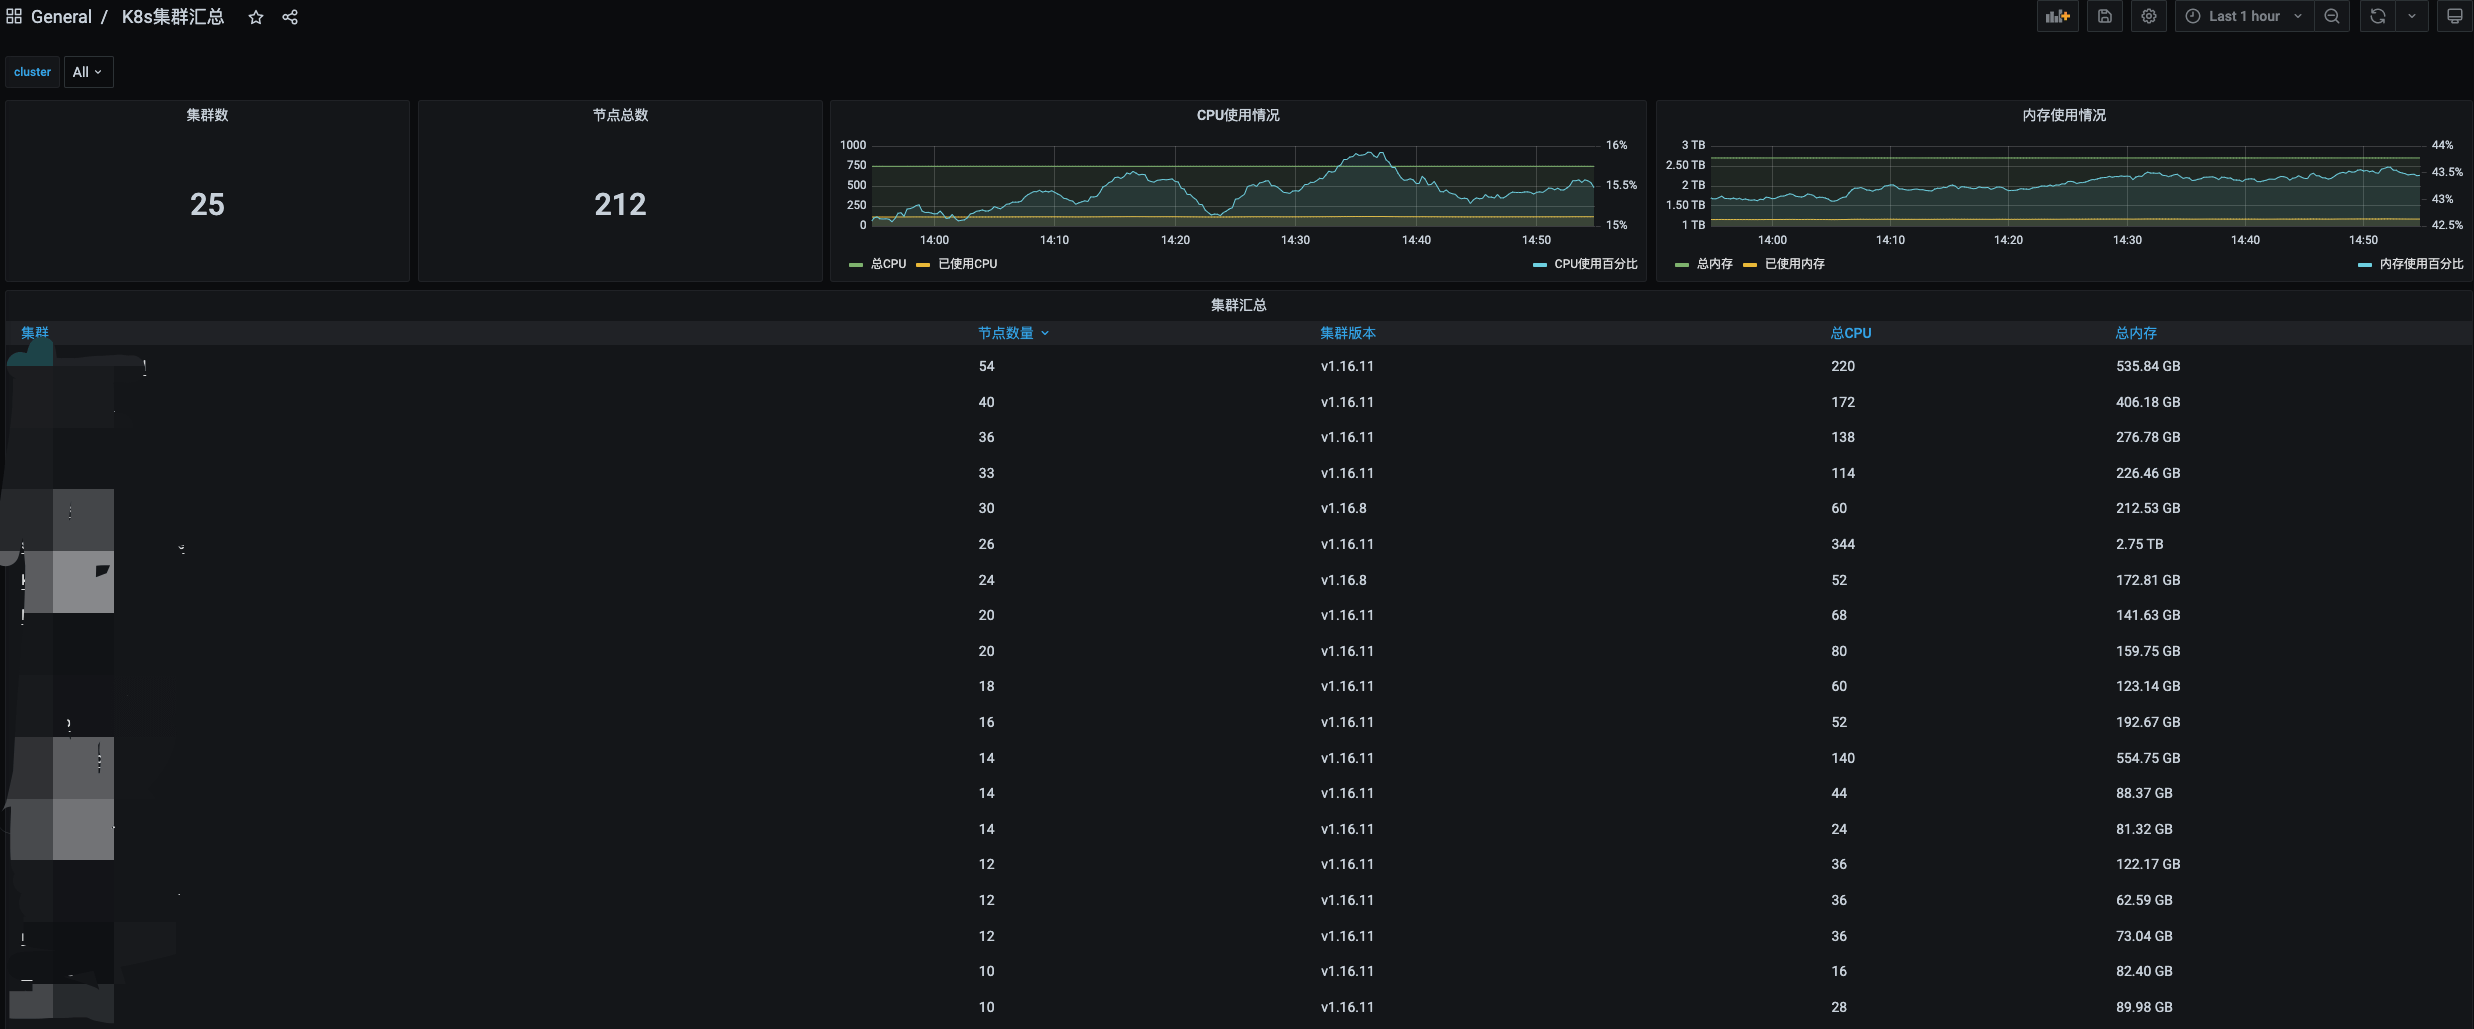
On the Grafana panel, we provide two levels of perspective: data sources for a region and for all regions, and panels for summary and details. The figure below is one of the summary panels:
5. Business Data Monitoring
Business data is mainly the data that businesses report themselves and care about, such as user login, ordering, and payment. This kind of data is heterogeneous and cannot be managed uniformly; we provide a unified solution and a Grafana service, and businesses draw their own charts.
The Thanos solution is used here; see: An Advanced User Guide about Thanos .
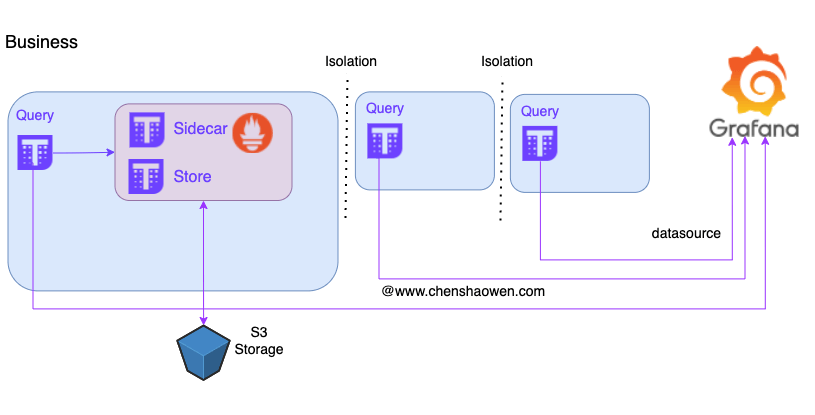
Below is the deployment topology:
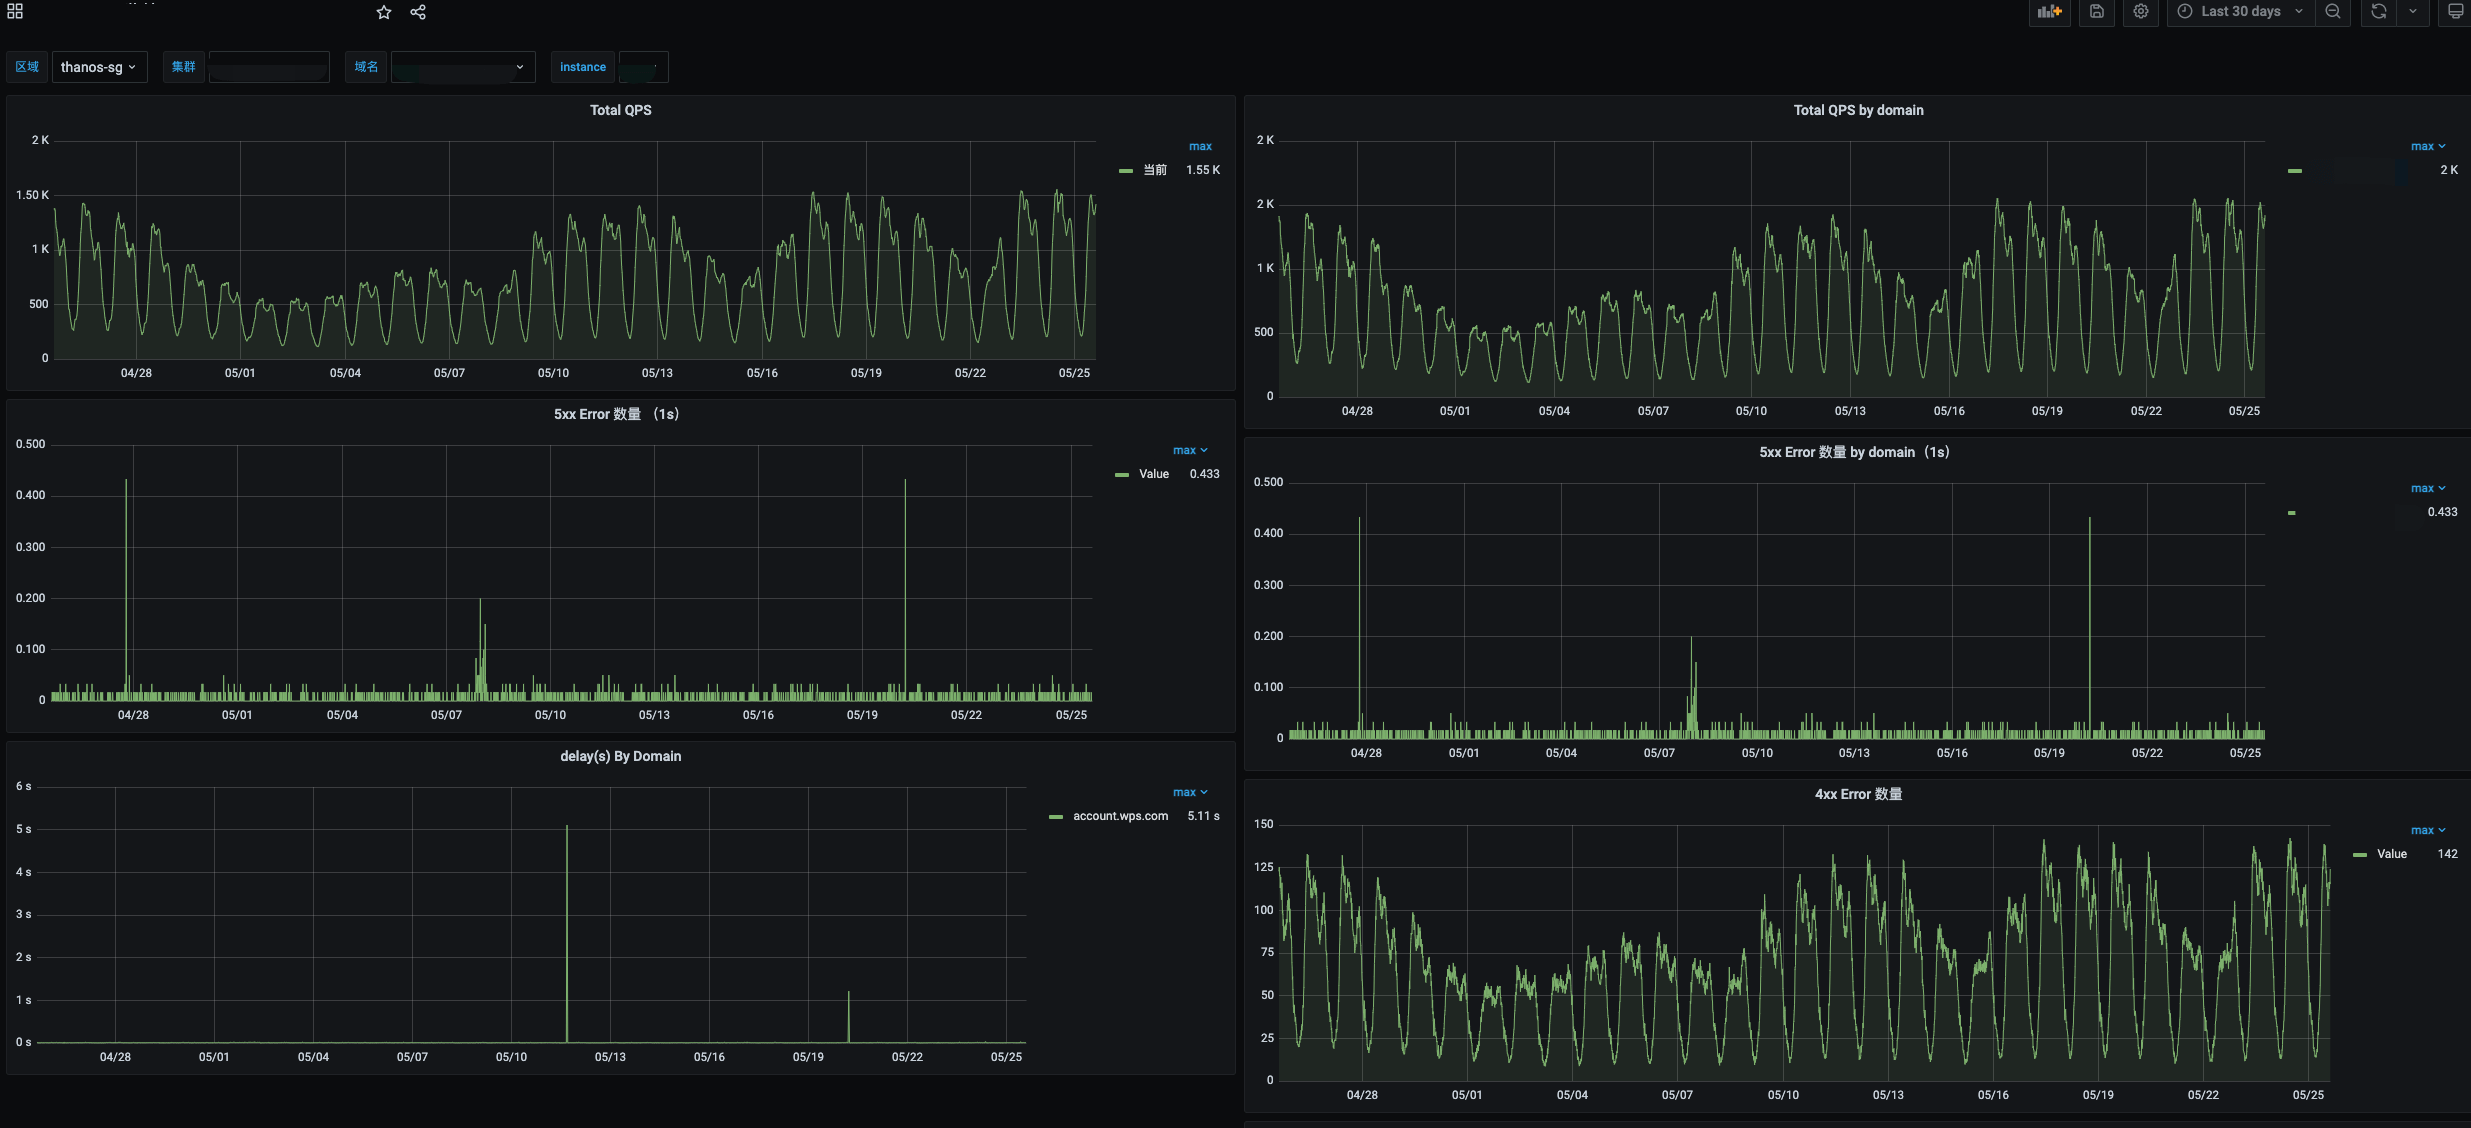
Below is querying long-cycle data:
6. Summary
This post mainly introduces some of the work being done recently. For the overseas multi-region scenario, we divided monitoring into three layers: basic monitoring, Kubernetes monitoring, and business monitoring data. Basic monitoring includes cloud hosts, Redis middleware, and so on, while Kubernetes is mainly for applications, and business data is the reported data of business relationships.
For this division into three layers, we provided three deployment solutions respectively to meet the business’s needs for monitoring queries.
