The Prometheus community moves so fast that some of the documents I wrote earlier have become outdated. I’ve recently started paying attention to observability again, filling in some of the gaps in my operations knowledge.
1. Terminology
- Grafana
A visualization tool that provides a variety of visualization panels and supports many data sources, including Prometheus, OpenTSDB, MySQL, and others.
- Prometheus
A time series database, mainly used to collect, store, and serve query data.
- Exporter
A program that exposes service monitoring metrics, providing an API endpoint for Prometheus to scrape monitoring data from.
- PromQL
Prometheus’s built-in data query language, which provides rich support for querying, aggregating, and performing logical operations on time series data.
2. Installing Prometheus
- Add the Helm repository
| |
- Install Prometheus
| |
If prometheus-node-exporter never comes up, the default port 9100 may be occupied. You can use the following command to edit the DaemonSet and change the default port:
| |
- Uninstall
| |
3. Installing Grafana
- Add the Helm repository
| |
| |
Note that with this installation method, Grafana’s data is stored under the /var/lib/grafana path inside the Pod, so restarting Grafana loses the related configuration. In a production environment you need to mount a storage volume. If a StorageClass is available, you can use the following parameter for persistent storage:
| |
- Get the login password for the admin account
| |
- Change the Grafana service’s access type to NodePort
| |
| |
This way, you can access Grafana via the host IP + 31892.
- Uninstall
| |
4. Configuration and Usage
4.1 Adding a Data Source
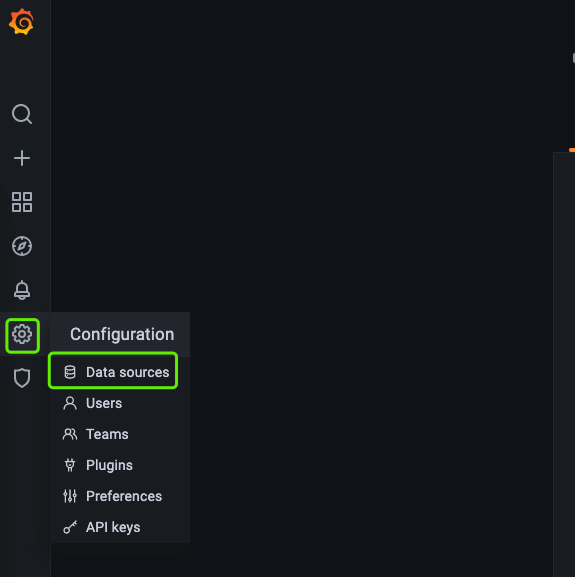
In the left navigation bar, find [Data Sources]
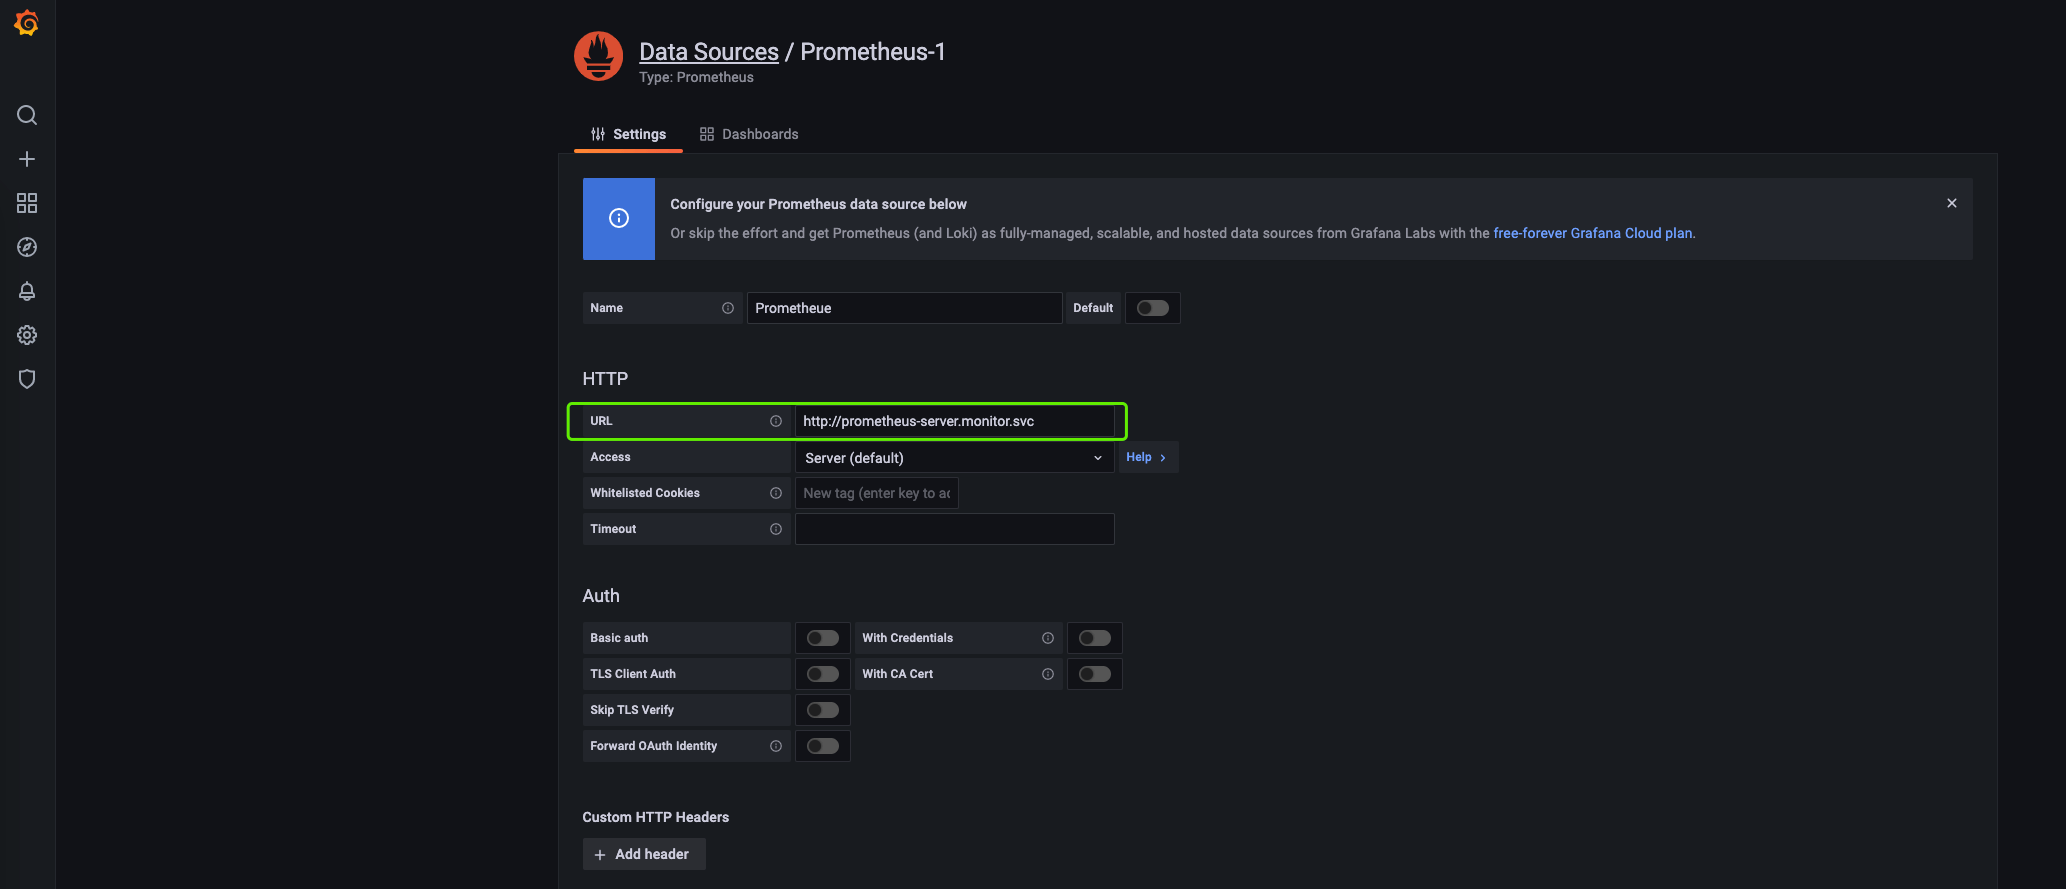
Just enter Prometheus’s access address http://prometheus-server.monitor.svc.
4.2 Adding a Template
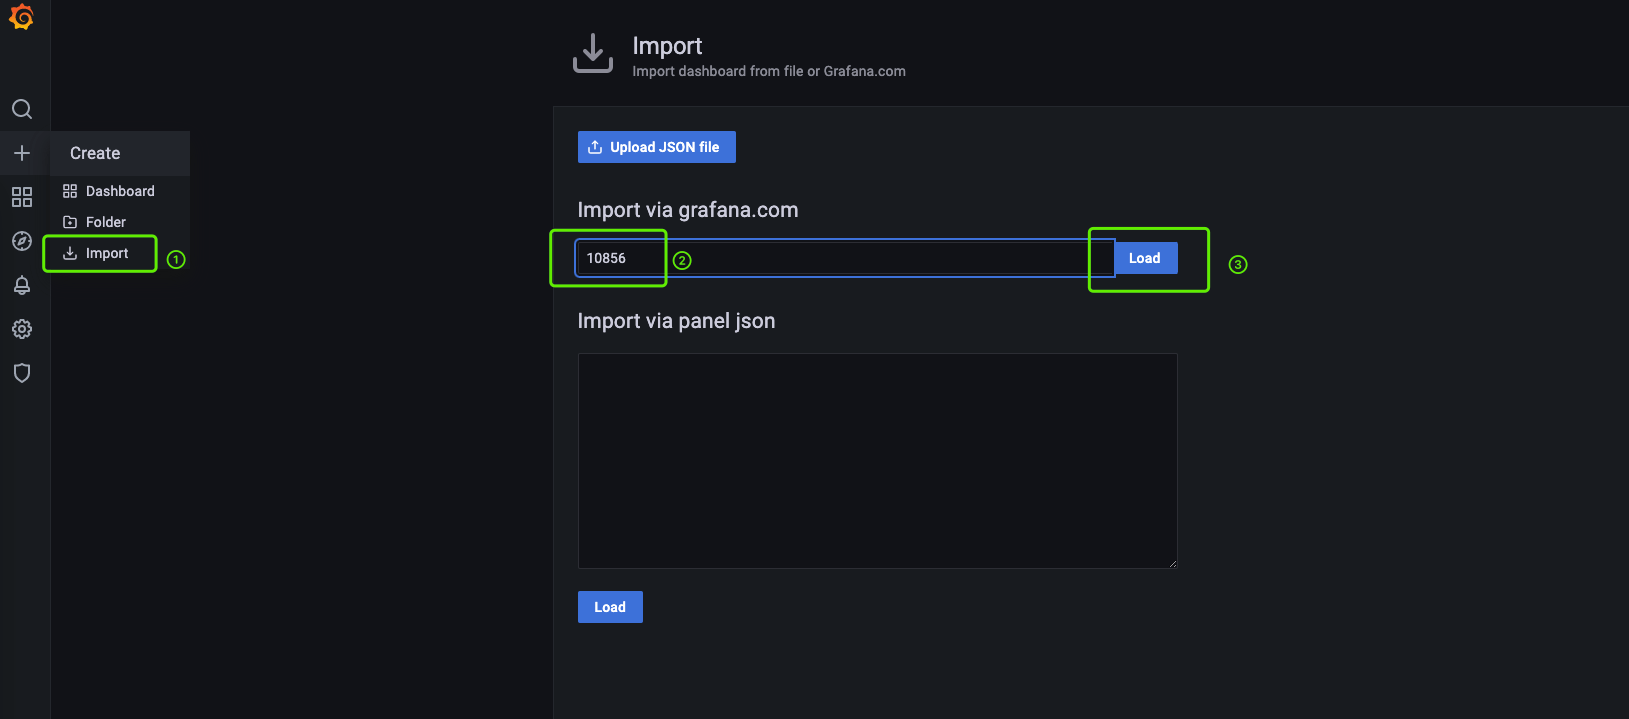
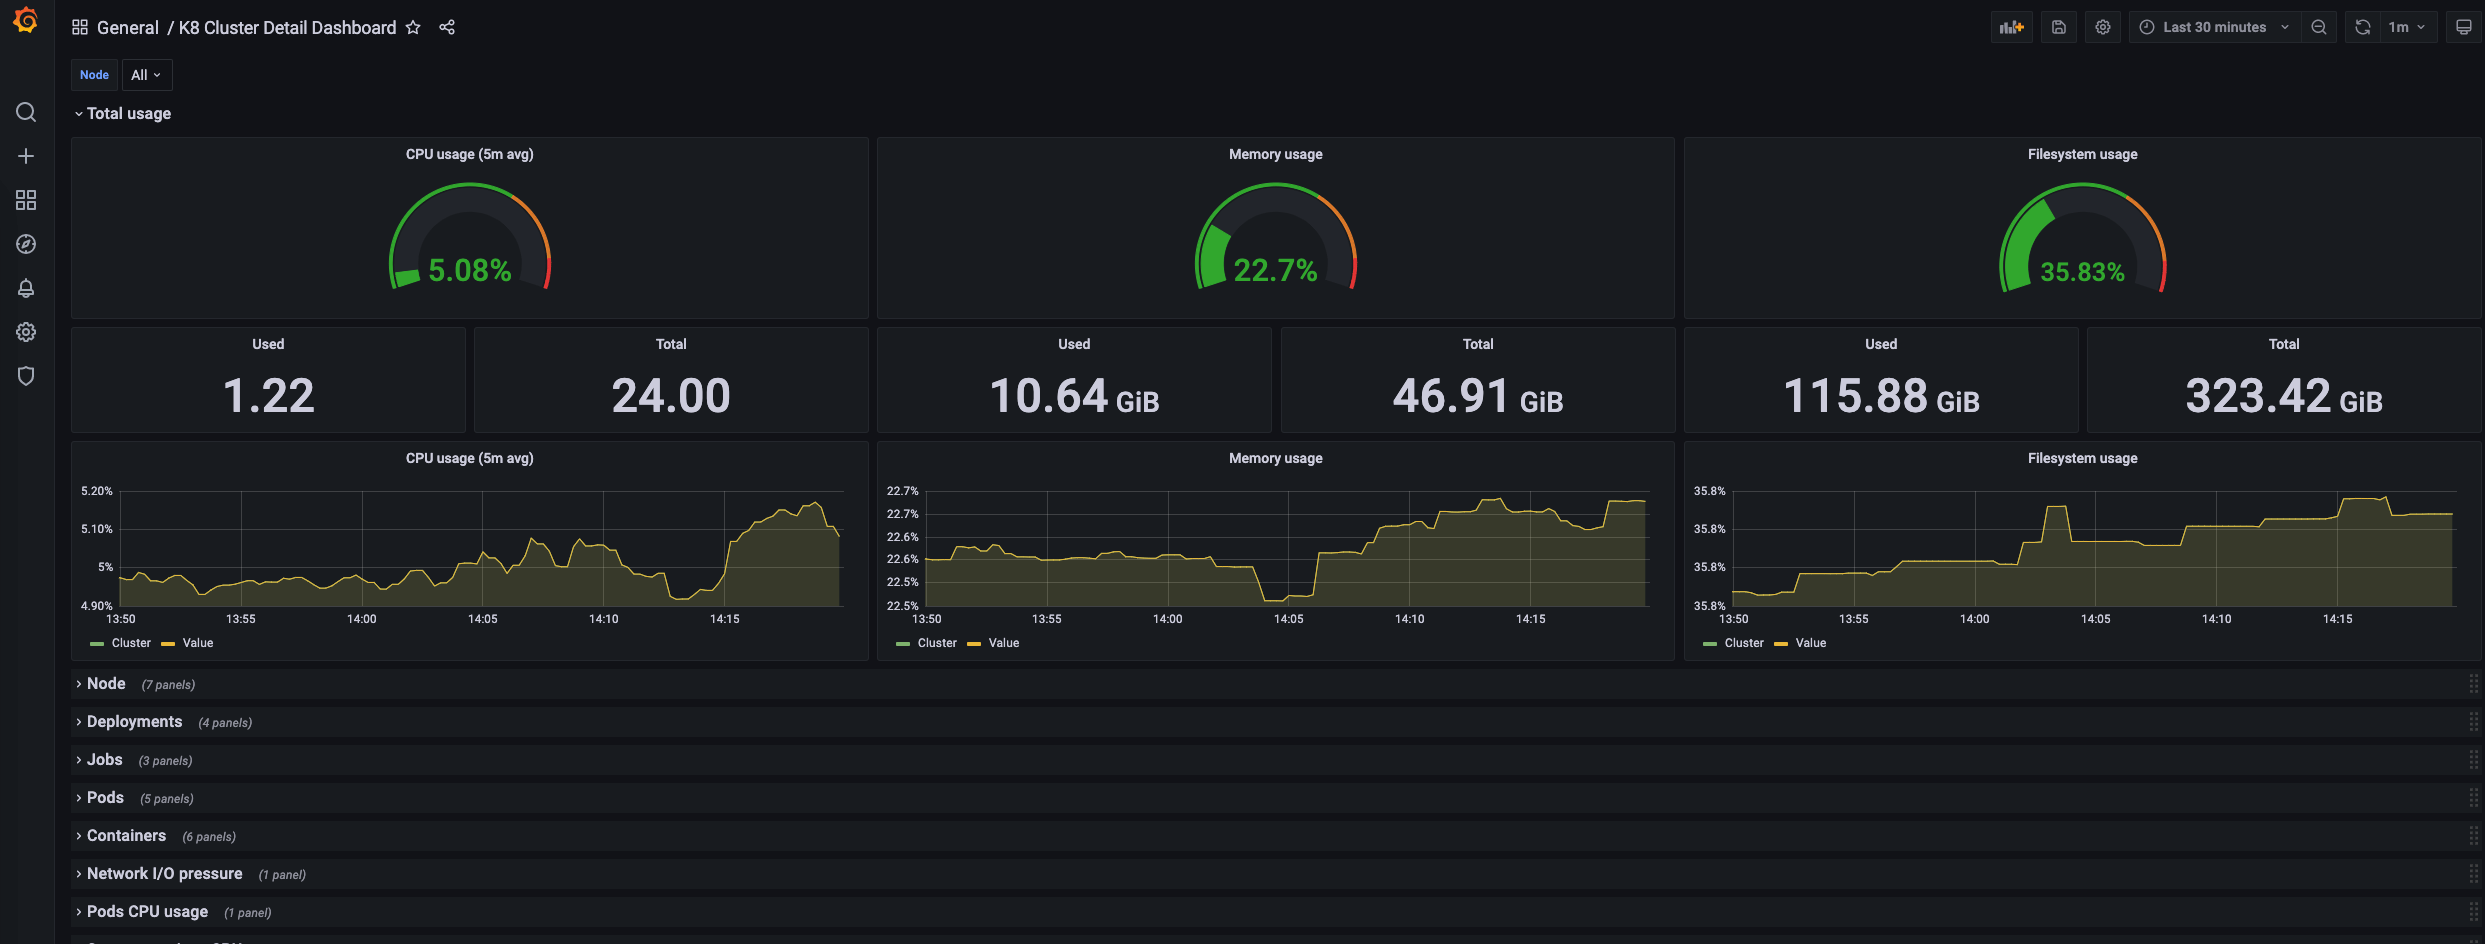
In the left navigation bar, find the Import button under [+]. I chose to import the dashboard with id 10856. You can also go to the Grafana website and pick a suitable dashboard to import, https://grafana.com/grafana/dashboards.
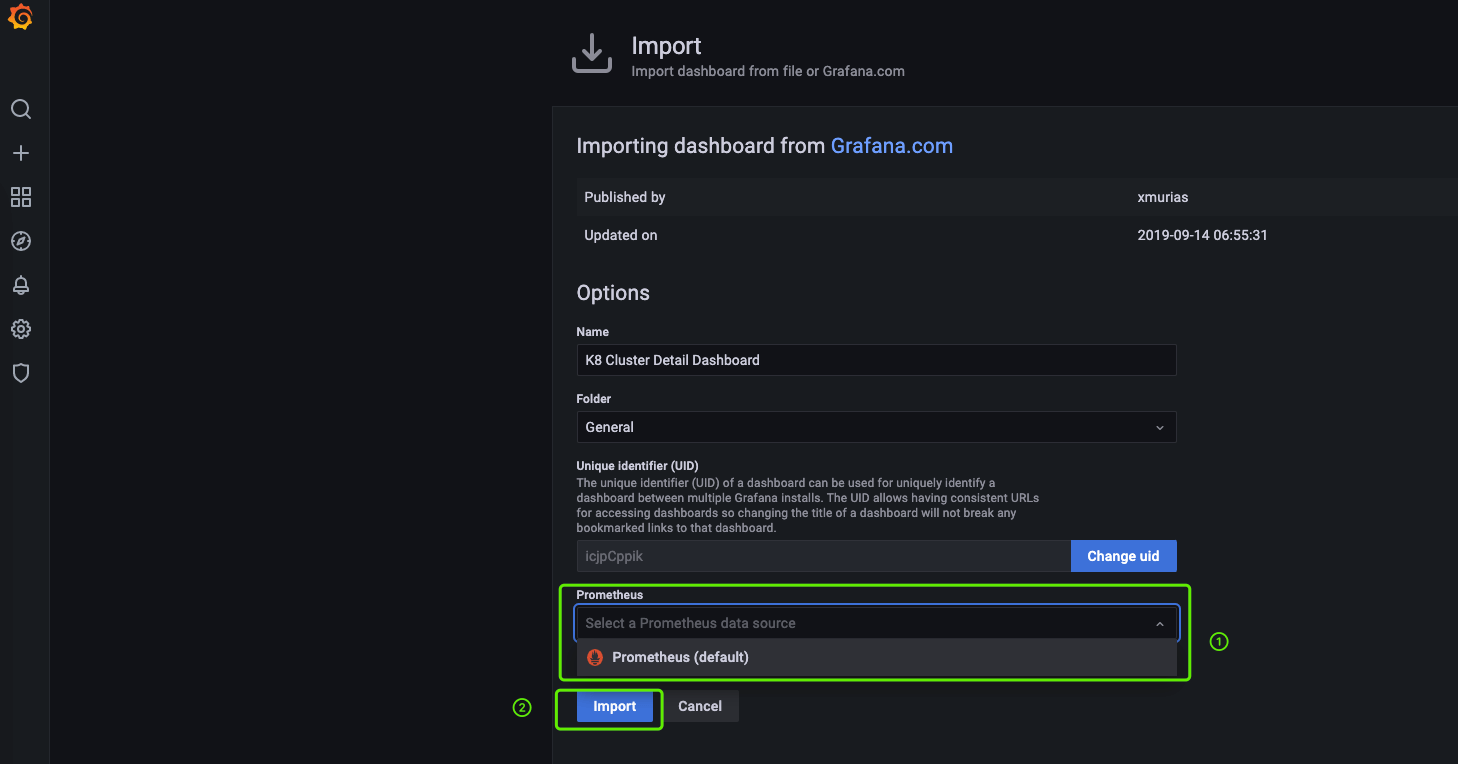
As shown below, here you need to select the data source you added above.
4.3 Viewing the Dashboard
4.4 grafana.ini Configuration
Some Grafana settings can only be made by editing grafana.ini; below I list only the few I used:
- Edit the configuration file
| |
- Add configuration
- Allow anonymous access
| |
- Allow Iframe embedding
| |
- Restart Grafana for the changes to take effect
| |
