1. Purpose of the Test
- Tune the parameters of the build cluster
- Probe the upper limit on the number of concurrent Tekton pipelines
- Give the optimal concurrency limit for a single cluster
2. Related Components and Machine Configuration
- Kubernetes version
v1.21.4
- Tekton version
v0.24.1, kept consistent with production
- OpenEBS version
localpv version 3.3.0, kept consistent with production
- Cluster node configuration, five nodes in total, four used for building
node1 master, scheduling disabled 32C/125GB/4T SSD
node2 master, worker 40C/125GB/4T SSD
node3 master, worker 32C/125GB/4T SSD
node4 worker 40C/125GB/4T SSD
node5 worker 40C/125GB/4T SSD
3. Cluster Parameter Tuning
The testing process is also, in effect, a process of continuously tuning the parameters of each component. So the parameters throughout the test were dynamic: whenever I found a bottleneck, I would adjust the parameters and then run the test case again.
3.1 kube-apiserver
–max-mutating-requests-inflight adjusted to 2000, default 200
–max-requests-inflight adjusted to 4000, default 400
Loosen the flow control of the component.
3.2 kube-controller-manager
–kube-api-qps adjusted to 200, default 20
–kube-api-burst adjusted to 300, default 30
Loosen the flow control of the component.
3.3 kube-scheduler-manager
percentageOfNodesToScore: with few nodes, no adjustment is needed.
Usually you need to keep percentageOfNodesToScore * total node count < 50
–kube-api-qps adjusted to 500, default 50
–kube-api-burst adjusted to 1000, default 100
Loosen the flow control of the component.
3.4 kubelet
–max-pods adjusted to 1000, default 110
There are few nodes and they are highly configured, so the Pod density on a single node will be very high.
3.5 tekton controller
-kube-api-qps adjusted to 200, default 5
-kube-api-burst adjusted to 500, default 10
-threads-per-controller adjusted to 100, default 2
The Tekton Controller runs as a single replica; after leader election among multiple replicas, it still works as a single replica. Multiple replicas provide better availability, and it is advisable to use them appropriately in production.
3.6 tekton webhook
Replica limit adjusted to 20, default 5
| |
The webhook is mainly used to validate the submitted data, and enough replicas can shorten the response time of data validation for the pipeline creation API.
3.7 etcd
–quota-backend-bytes adjusted to 8589934592 (8G), default is 2G
There are too many Pods and pipelines being placed, so the Etcd storage is not enough.
3.8 docker
- Upgrade from 20.10.8 to 20.10.12
This upgrade is extremely important, because at build time the host’s Docker socket is usually mounted, but builds of the Nodejs kind report an error when making system calls. The error message is as follows:
| |
In this case, if you are running an image, it is very simple to just add --security-opt seccomp=unconfined, but docker build does not support that parameter. The cluster already had 20.10.8 installed, so the only option was to copy the 20.10.12 versions of docker, dockerd, docker-init, and docker-proxy over the old ones, then restart the machine.
Docker 20.10.12 may have significant security changes compared with 20.10.8.
4. Other Notes
- Tekton Metrics collection was enabled
To obtain some internal Tekton metrics, such as the number of runs.
- kube-state-metrics had label and annotation collection enabled
This is very resource-intensive, but a lot of metadata can be obtained for Grafana dashboards.
For how to enable the collection above, you can refer to the earlier articles.
5. Capacity Estimation
- CPU and memory resources
The total available resources of the whole cluster are about 152C 550GB; subtracting the base component consumption when idle, there are about 149C 535 GB.
I ran a test pipeline in advance, and the CPU consumption was almost 0 while the MEM consumption was about 180 MB.
By this estimate, the cluster can provide 535 * 1024/ 180 > 3000 » 1000 pipelines of concurrent execution capacity.
- Number of Pods
The Kubelet Pod limit is loosened to 1000, for a total capacity of 4000 Pods
Each test pipeline occupies 4 Pods: one affinity-assistant + three Pods (three Tasks in total).
4000 Pods minus the system components is not enough, but the number of Pods can in fact exceed the Kubelet setting, so it is also enough to support 1000 concurrent pipelines.
6. Test Case
| |
The reasons for choosing this pipeline are:
- Builds in production average about 3m and usually have 2-3 tasks
- What I mainly want to test is the performance of Tekton and its infrastructure; to increase the cluster’s concurrency, I deliberately used a low-power pipeline. Otherwise, adding external dependencies would make the scenario very complex and would also be bad for reproducing the experiment.
7. Test Results
7.1 Concurrency vs. Execution Duration
| Concurrency | Trigger/Execution Success Rate | Average Execution Duration | Shortest/Longest Execution Duration | Tekton Dashboard | Component Pressure |
|---|---|---|---|---|---|
| 1 | 100%/100% | 3m37s | 3m24s~3m53s | OK | None |
| 50 | 100%/100% | 4m20s | 4m~5m7s | OK | None |
| 100 | 100%/100% | 4m30s | 4m15s~5m22s | OK | Pressure on kube-apiserver and prometheus increases significantly |
| 200 | 100%/100% | 8m50s | 7m55s~9m25s | OK | Average duration increases significantly |
| 400 | 100%/100% | 16m5s | 12m11s~17m04s | Not smooth | Differences in execution time increase noticeably |
| 800 | 100%/100% | 35m26s | 12m21s~42m21s | Very laggy | - |
| 1600 | 100%/100% | 50m12s | 12m58s~85m59 | Won’t open | - |
7.2 Tekton Pipeline Creation Speed
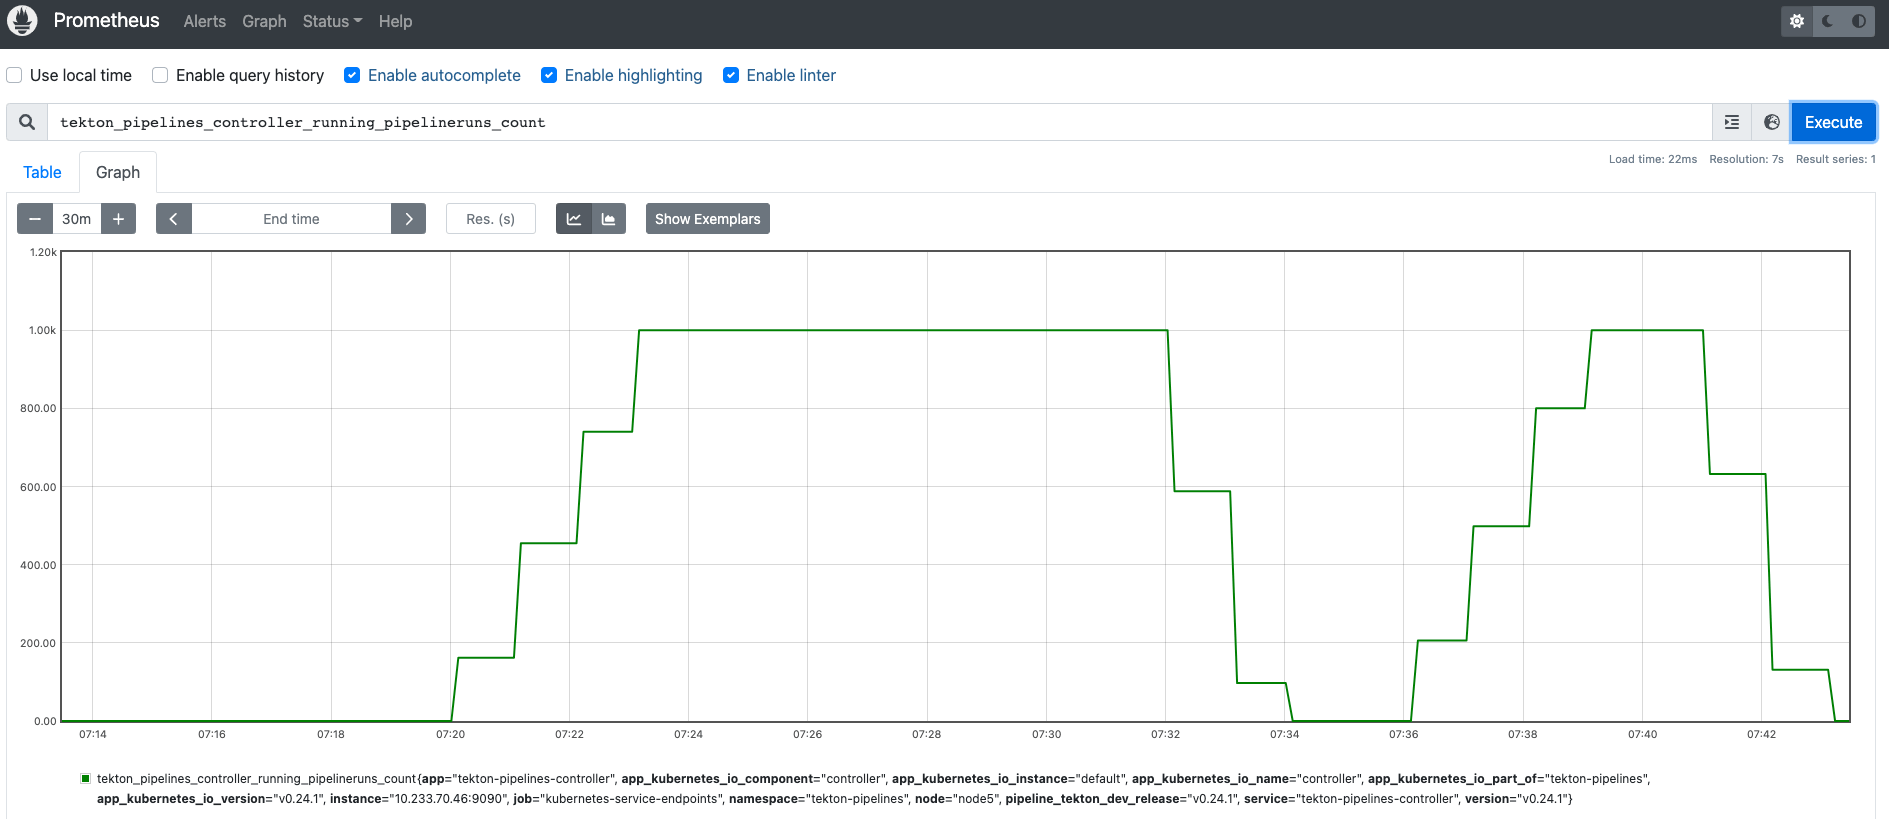
With the cluster parameters above, 1k pipelines take about 200 seconds to be fully created, an average creation speed of 5 per second.
8. Summary
Although the actual task only runs for 3m, the average execution time of a single pipeline is 3m37s, of which 37s is spent creating Pods. You can save pipeline execution time by reducing tasks and adding steps to reduce the number of Pods.
Under concurrency, pipelines do not finish in the order they were triggered. Executing each task of a pipeline requires creating a Pod, which causes pipelines to compete with each other and prevents all the tasks within a single pipeline from finishing quickly.
Starting from 100 concurrency, each doubling of the concurrency doubles the average execution time. At 200 concurrency, doubling the execution time is unacceptable. Therefore the concurrency of a single cluster should be kept within 100.
Although the data only goes up to 1600, in fact the test held up at close to 10k, but the pipeline execution time was far too long. A pipeline that originally only needed 3 m to finish actually needed several hours under high concurrency, which has already lost its practical meaning.
