1. Symptoms
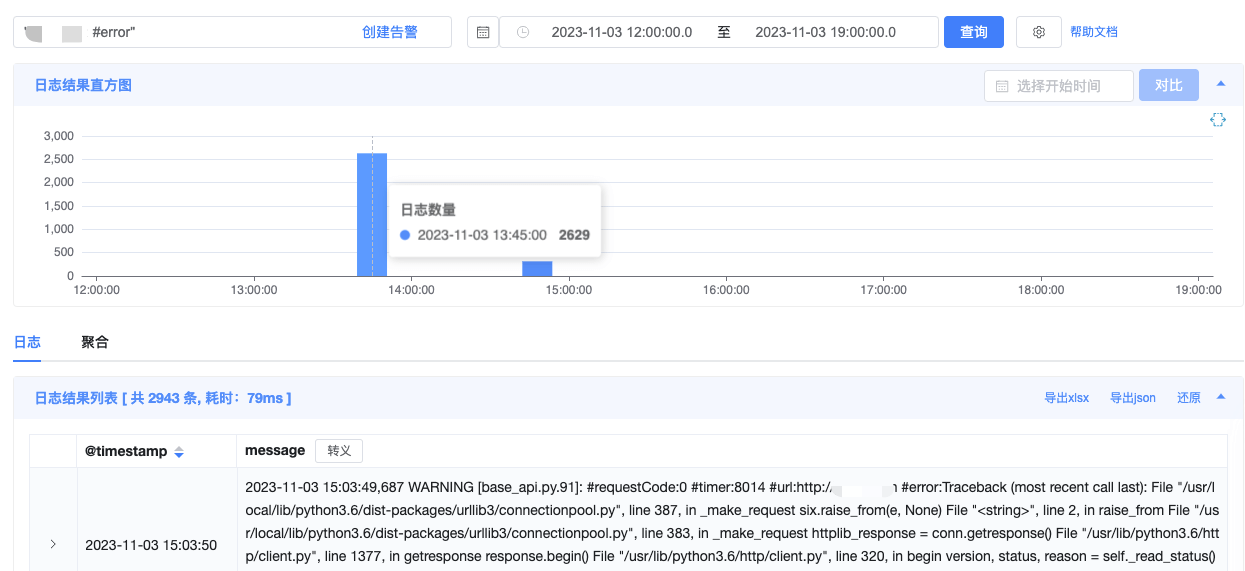
The business side reported that the API of application app-a was slow. Looking at the logs, one particular Pod was slow, and deleting that Pod so it moved to another node fixed it.
From the monitoring metrics you can see that the Pod’s CPU usage did indeed spike sharply.
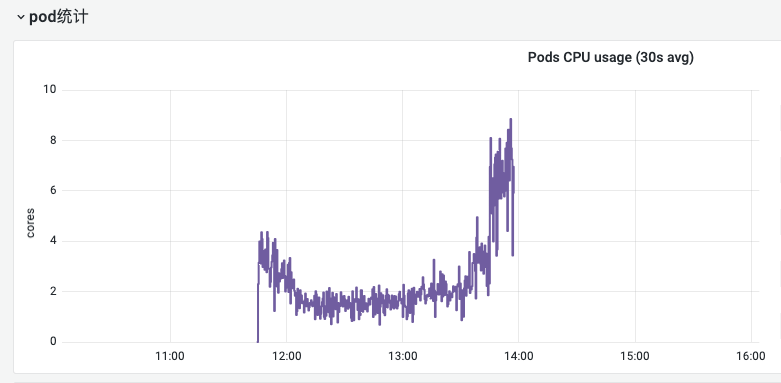
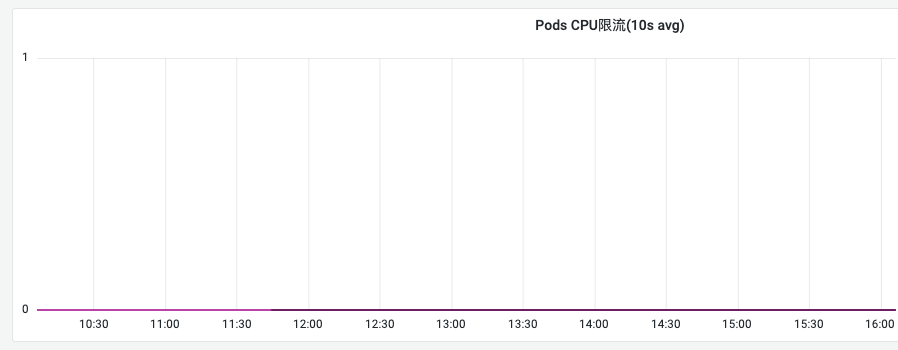
But that Pod had not reached its Limit, so it was not being CPU-throttled.
Next, looking at the node’s CPU monitoring, the node’s CPU usage had also spiked sharply.

And the increase was in System CPU — that is, CPU in kernel mode.


Going further, the increase was confirmed to be System CPU — that is, CPU in kernel mode.
The main scenarios that use kernel-mode CPU are networking, disk IO, and so on.
2. Investigating the Problem
2.1 Investigating Disk IO
High iowait does not mean high disk IO. High iowait only means the CPU spends a long time waiting on IO, but it is not necessarily caused by high disk IO — it can also be caused by high network IO. Low iowait, however, does let you conclude that disk IO pressure is low.
From the monitoring above you can see that the CPU’s iowait is low, which means the disk is not the bottleneck.
Also, from the monitoring metrics, the disk IO throughput and IOPS show no abnormal fluctuation.
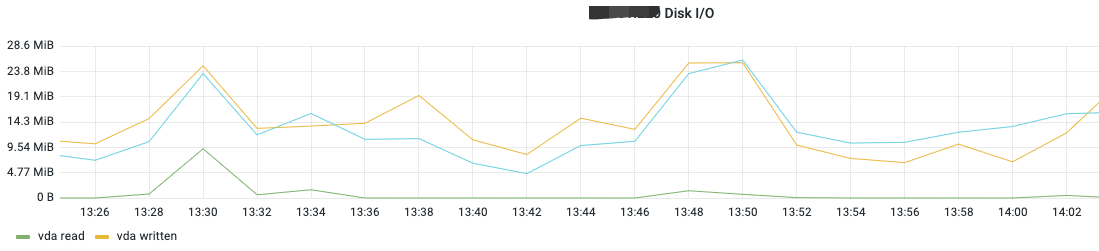
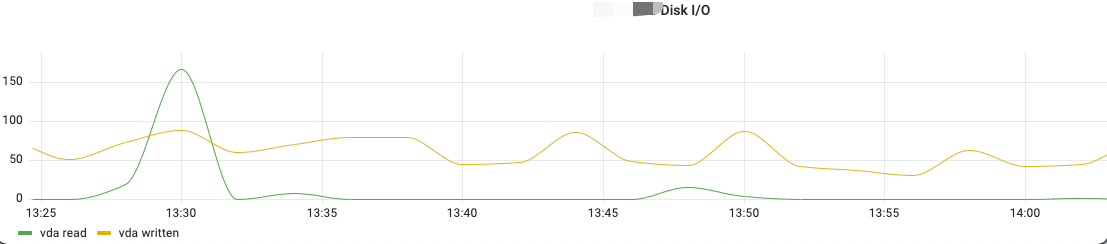
You can also combine metrics such as the disk device’s average IO queue depth, read latency, and write latency to further confirm whether the disk IO is abnormal.
At this point, a disk IO bottleneck is basically ruled out.
2.2 Investigating Network IO
For network IO, first look at the node’s ingress and egress traffic, then find the Pod with the abnormal traffic.
From the monitoring you can see that the node’s network IO has abnormal fluctuation, from 500 Mbps to 800 Mbps.

Next, find the Pod with abnormal traffic on this node.
2.3 Finding the Problem
Very quickly, I found that Pod from the monitoring system.
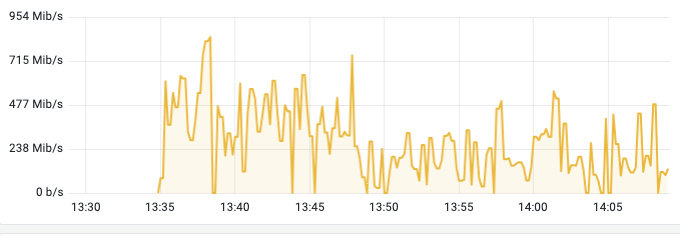
The timing matches well, with a large amount of network IO and a sharp spike in CPU usage.
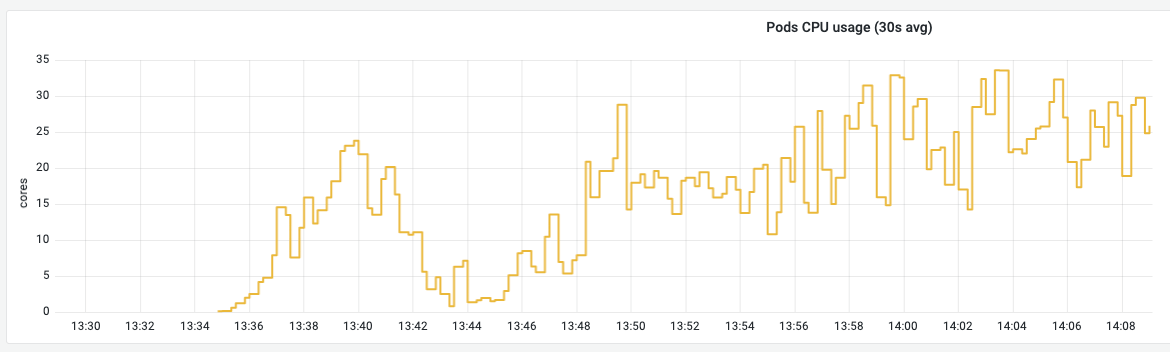
It turned out to be application app-b, which during HPA scale-out scheduling happened to be scheduled onto this node, causing the node’s network IO and CPU usage to spike sharply, which affected the latency-sensitive application app-a and made its API slow.
2.4 Solving the Problem
The solution is to use Pod anti-affinity to isolate application app-a and application app-b at the scheduling layer, so that they do not exist on the same node at the same time.
| |
At this point, the slowness of application app-a had improved a lot compared with before, but it still occurred occasionally. So I continued to spend some more time investigating.
3. Why the Pod’s CPU Was Not Throttled
I once suspected that application app-a’s Pod CPU was being throttled and that the monitoring metrics simply were not reflecting it. But after investigating for a while, I did not find any related evidence. That guess was probably wrong.
3.1 The CFS Throttling Mechanism in K8s
CFS is a mechanism in the Linux kernel used to implement CPU bandwidth control; it can set an upper bound on the CPU time a process group may use.
Usually, the measurement period for CPU usage is 100ms. The CPU Limit determines the upper bound of CPU time that can be used in each measurement period — that is, within 100ms.
1 CPU means that within 100ms, you can use 1 core’s worth of CPU time; 2 CPU means that within 100ms, you can use 2 cores’ worth of CPU time. But if it is 0.5 CPU, then within 100ms it is not 0.5 cores’ worth of CPU time, but rather 50ms of CPU time, because CPU cores are integers and cannot be split — what can be split is the occupation time.
This is not about the utilization rate; whether the application uses the CPU for computing or leaves it idle, it all counts.
If CPU usage exceeds the time specified by the CPU Limit, use will be throttled. There is actually another detail here: how often CPU usage is scheduled. This is also a question I am very interested in, and I will continue to analyze it in a later article.
3.2 How kubelet Collects Pod CPU Metrics
- Service discovery configuration in Prometheus
| |
The data collection path is cAdvisor -> kubelet -> kube-apiserver -> Prometheus.
- cAdvisor’s collection of CPU metrics
The main CPU throttling metric is container_cpu_cfs_throttled_seconds_total. Here is its definition in the cAdvisor source code:
| |
How cAdvisor obtains CPU metrics:
| |
The kernel modifies these container files dynamically, and cAdvisor watches for changes to these files. When a file is created, it means a new container has been created; when a file changes, it means a metric has changed. Both of these trigger metric collection.
Inside a container, you can see these files:
| |
Among them, the files related to CPU throttling are
- cpu.cfs_period_us
- cpu.cfs_quota_us
| |
The 100000 here is microseconds, that is, 100 ms, which is the period used by the cfs control program on one CPU.
| |
The 200000 here is microseconds, that is, 200 ms. cfs_quota_us represents the total time period; here it means the 100 ms of two CPU cores at the same time.
And the throttling metrics are stored here:
| |
Where,
- nr_periods: the number of periods already used
- nr_throttled: the number of periods that were throttled
- throttled_time: the throttled clock duration, in nanoseconds
In the Pod’s monitoring metrics, you can see:
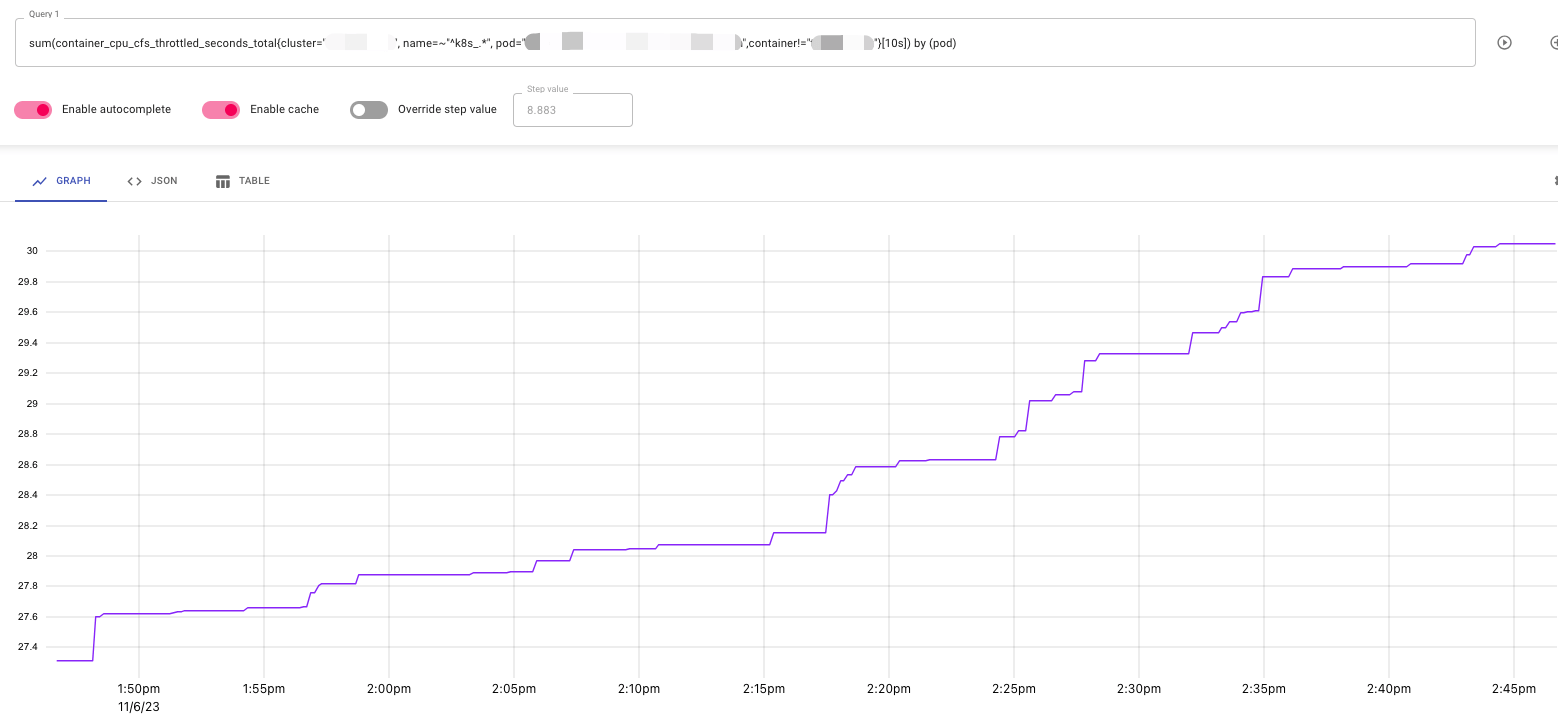
- Prometheus scraping of the metrics
| |
The scrape period is rather long, at 60s. For Counter-type metrics this only loses precision but will not miss features, which contrasts sharply with Gauge.
From collection to scraping, I found no place where CPU throttling monitoring could be missed.
3.3 Could the Alerting System Miss Abnormal Features
In the alerting system, irate is used and the time range is 10s. A 10s interval can show more detail, as in the figure below:
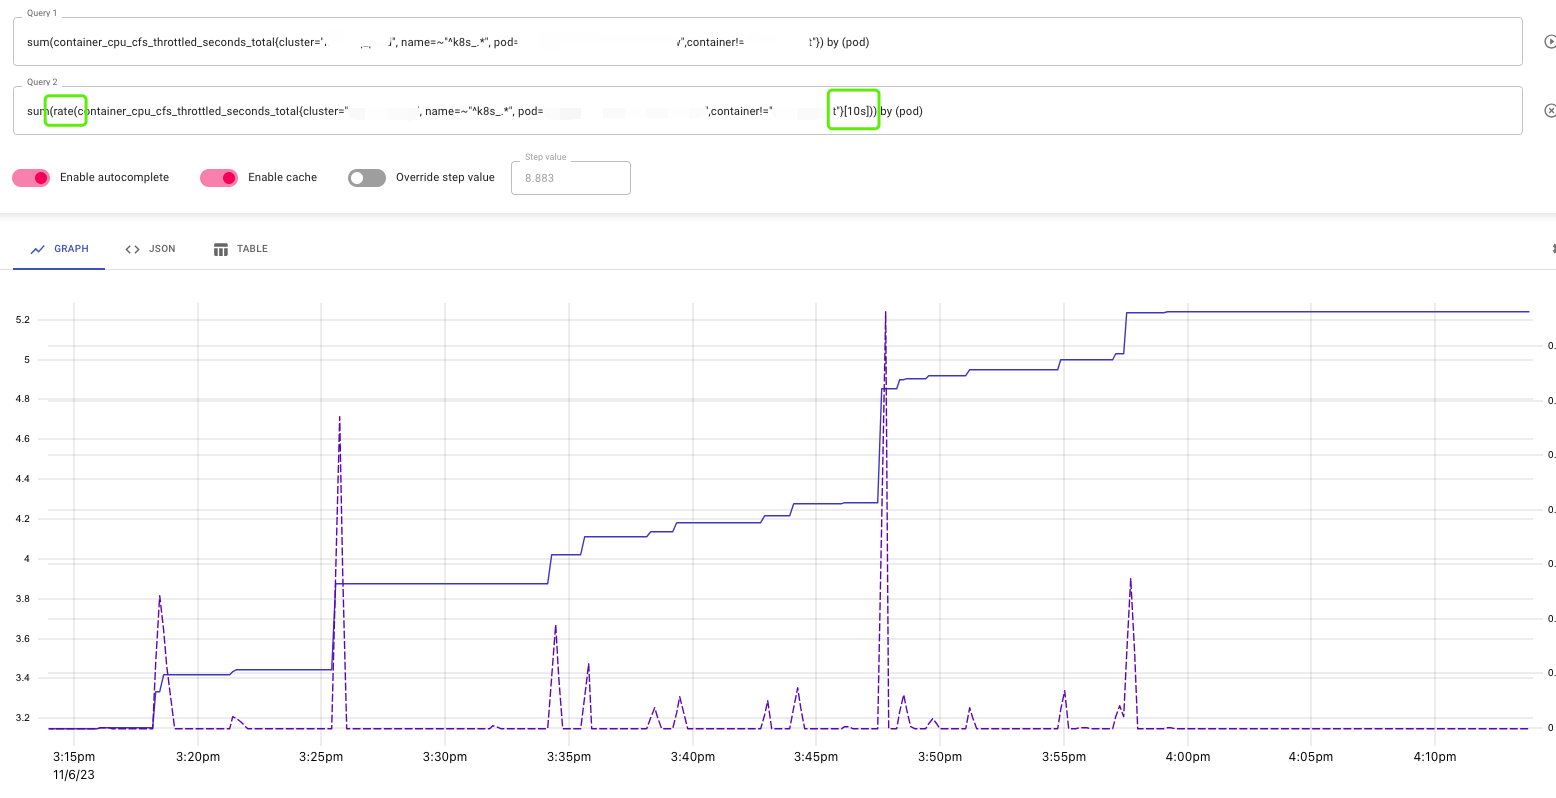
But it is not good for monitoring alerts; rate can show the trend, and a 5m interval is good for monitoring alerts.
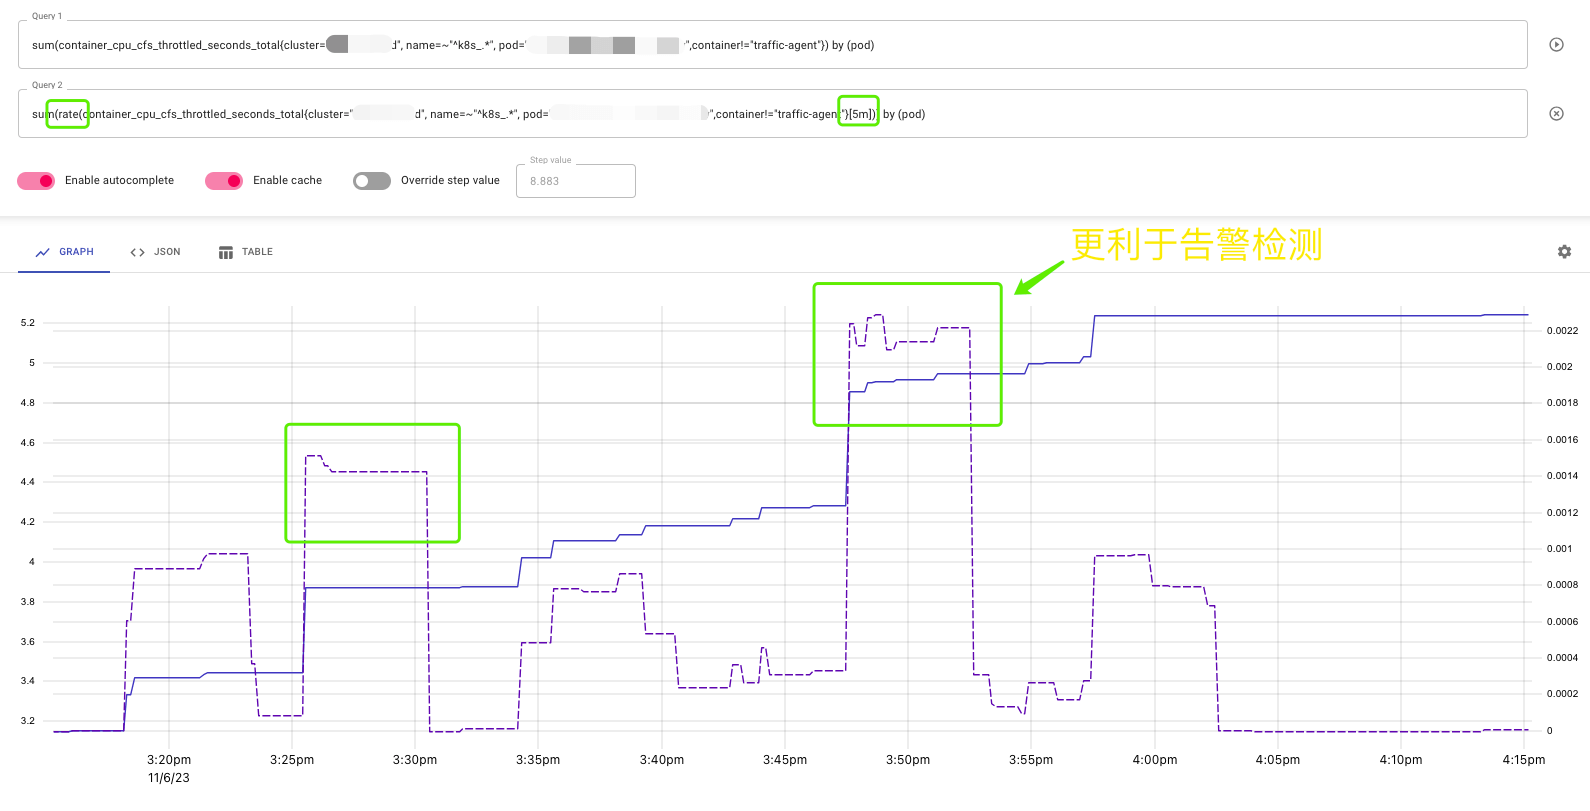
Therefore it is possible that some CPU throttling spikes cannot be detected by the alerting system.
Unfortunately, in this scenario, I searched over and over many times and did not find any CPU throttling spikes.
4. Could It Be Slow Network Traffic Forwarding
4.1 Abnormal Logs in kube-proxy
One abnormal log entry here caught my attention.
| |
It turns out kube-proxy mounts /run/xtables.lock, so that only one place can operate iptables.
| |
If another process on the host is also operating iptables, kube-proxy will wait. But this log appeared only sporadically, and it did not match the timing of the anomaly.
4.2 kube-proxy Startup Configuration
| |
Here, syncPeriod means a full sync of the iptables rules every 30s. So what happens if the sync has not finished when the next 30s sync period comes around?
4.3 kube-proxy Is Really Slow at Updating iptables
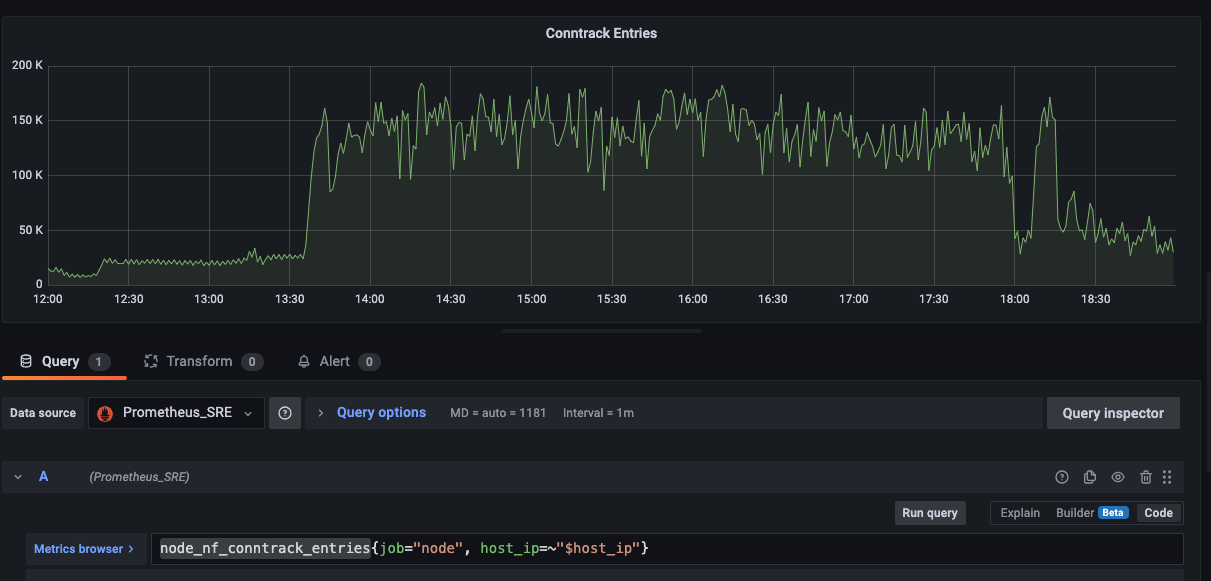
Application app-b downloads files in large batches and stores them in memory, causing the node’s network IO pressure, NF_CONNTRACK table entries, and the node’s CPU pressure all to spike sharply.
Although kube-proxy had not restarted and had not been OOMKilled, kube-proxy’s kubeproxy_network_programming_duration_seconds_bucket P99 metric did show abnormal fluctuation. As in the figure below:
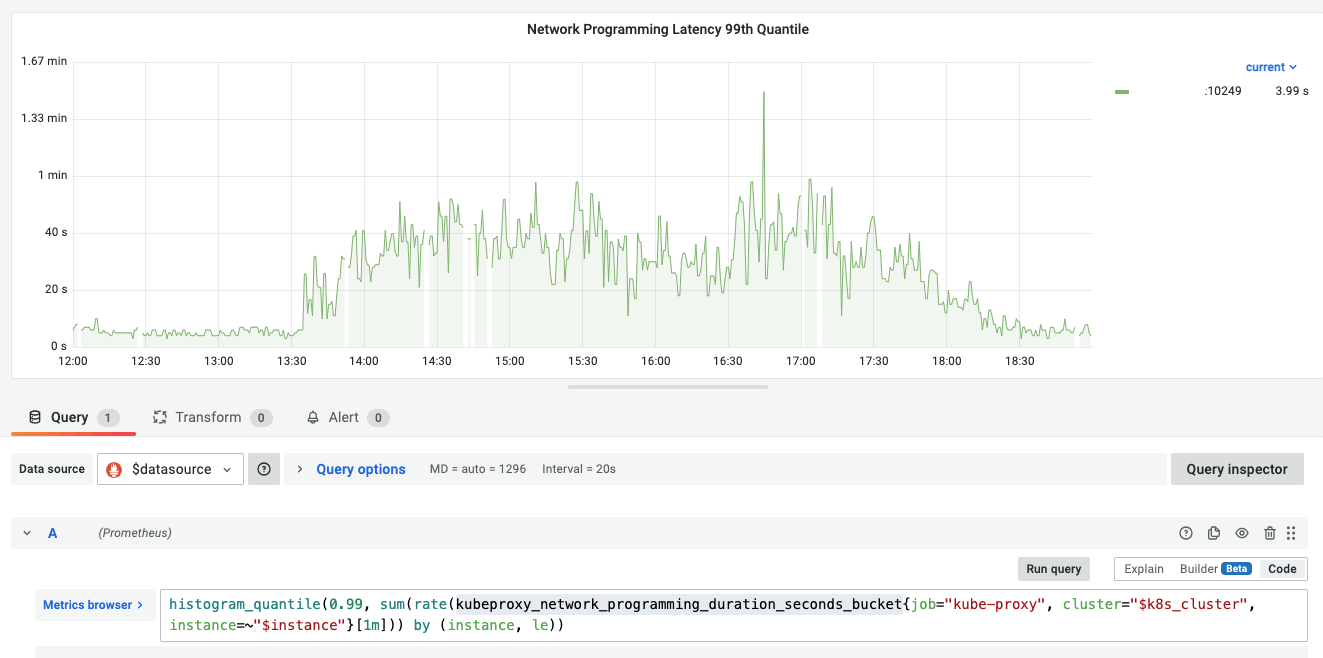
If kube-proxy is slow to sync iptables rules, it may cause a Pod’s traffic to be removed too late, forwarding traffic to a Pod that no longer exists.
But when application app-a timed out abnormally, there was no Pod rescheduling or Pod IP change taking place.
Next, I looked at the monitoring values for the nf_conntrack table; it was not full either, and the limit was extremely high.
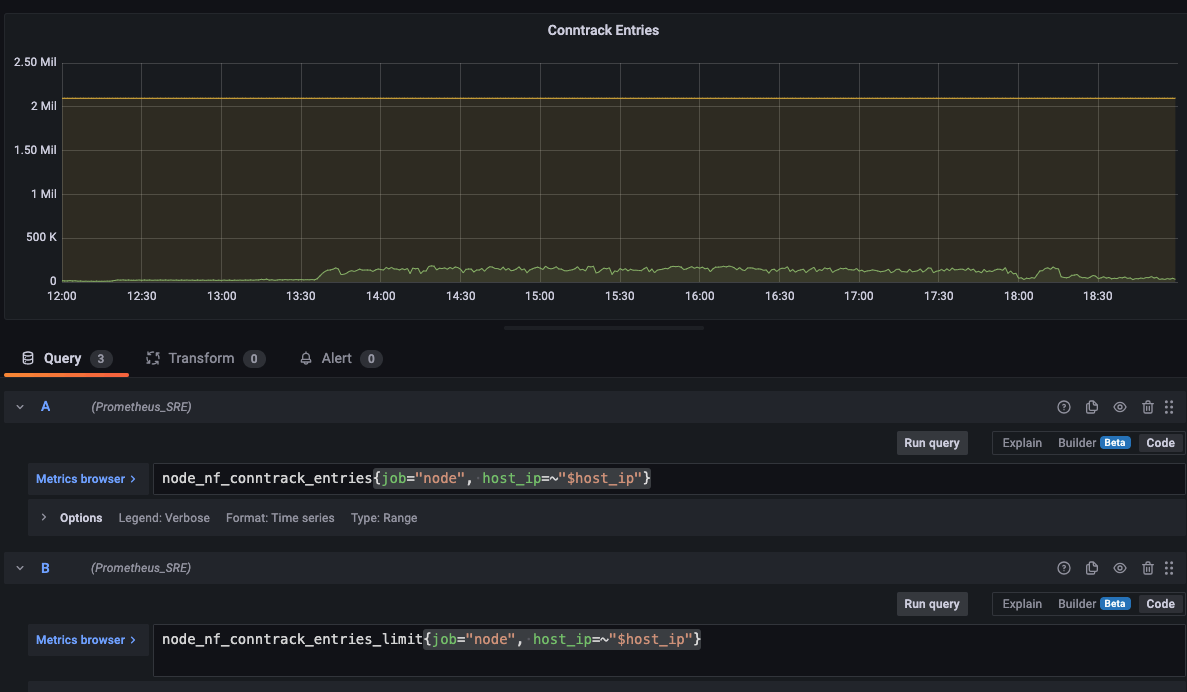
At this point, I had wasted a lot of time and still had not found the root cause of the problem.
5. Slow Inference When the Application Uses CPU
Fortunately, I am not only an SRE but also responsible for developing CICD, so I went straight to reading the code of application app-a. It turned out that application app-a uses the PyTorch framework to run inference on CPU.
| |
An inference application running on CPU is different from an ordinary application:
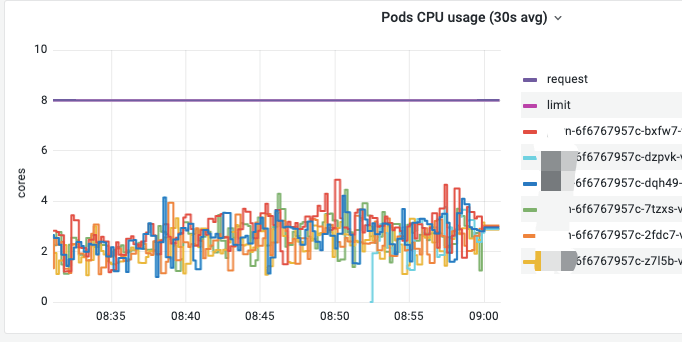
Although a large amount of CPU is provided, the CPU usage is very low, and at the same time a large number of inference tasks still take 3-257s, with slow inference at peak reaching 800/second.
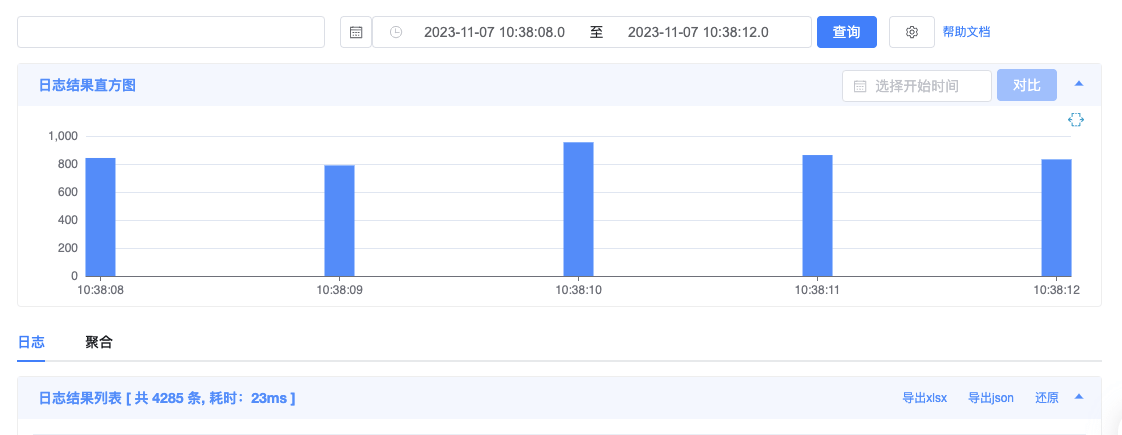
At this point, there were no other clues. It was not entirely a problem of IaaS-layer resources; it was mainly that the CPU could not keep up with low-latency, high-throughput inference tasks.
6. Summary
This article mainly records one troubleshooting process for application slowness. In the end I did not find the root cause, but I did discover quite a few of the large cluster’s current problems.
The main approach when troubleshooting application slowness is as follows:
- CPU throttling: check whether the Pod’s CPU metrics and the node’s CPU metrics are abnormal
- Slow disk IO: check whether iowait, iops, io queue depth, read/write latency, etc. are abnormal
- Slow network: along the traffic path, check whether the network metrics are abnormal
- Services the application depends on: app-a in this article has no external dependencies, so this step was skipped
Since what I ran into this time was an inference application, it would actually also involve factors such as the length of the input text, the size of BATCH_SIZE, and the complexity of the model, but these factors are all application-layer problems and are outside the scope of this article.
