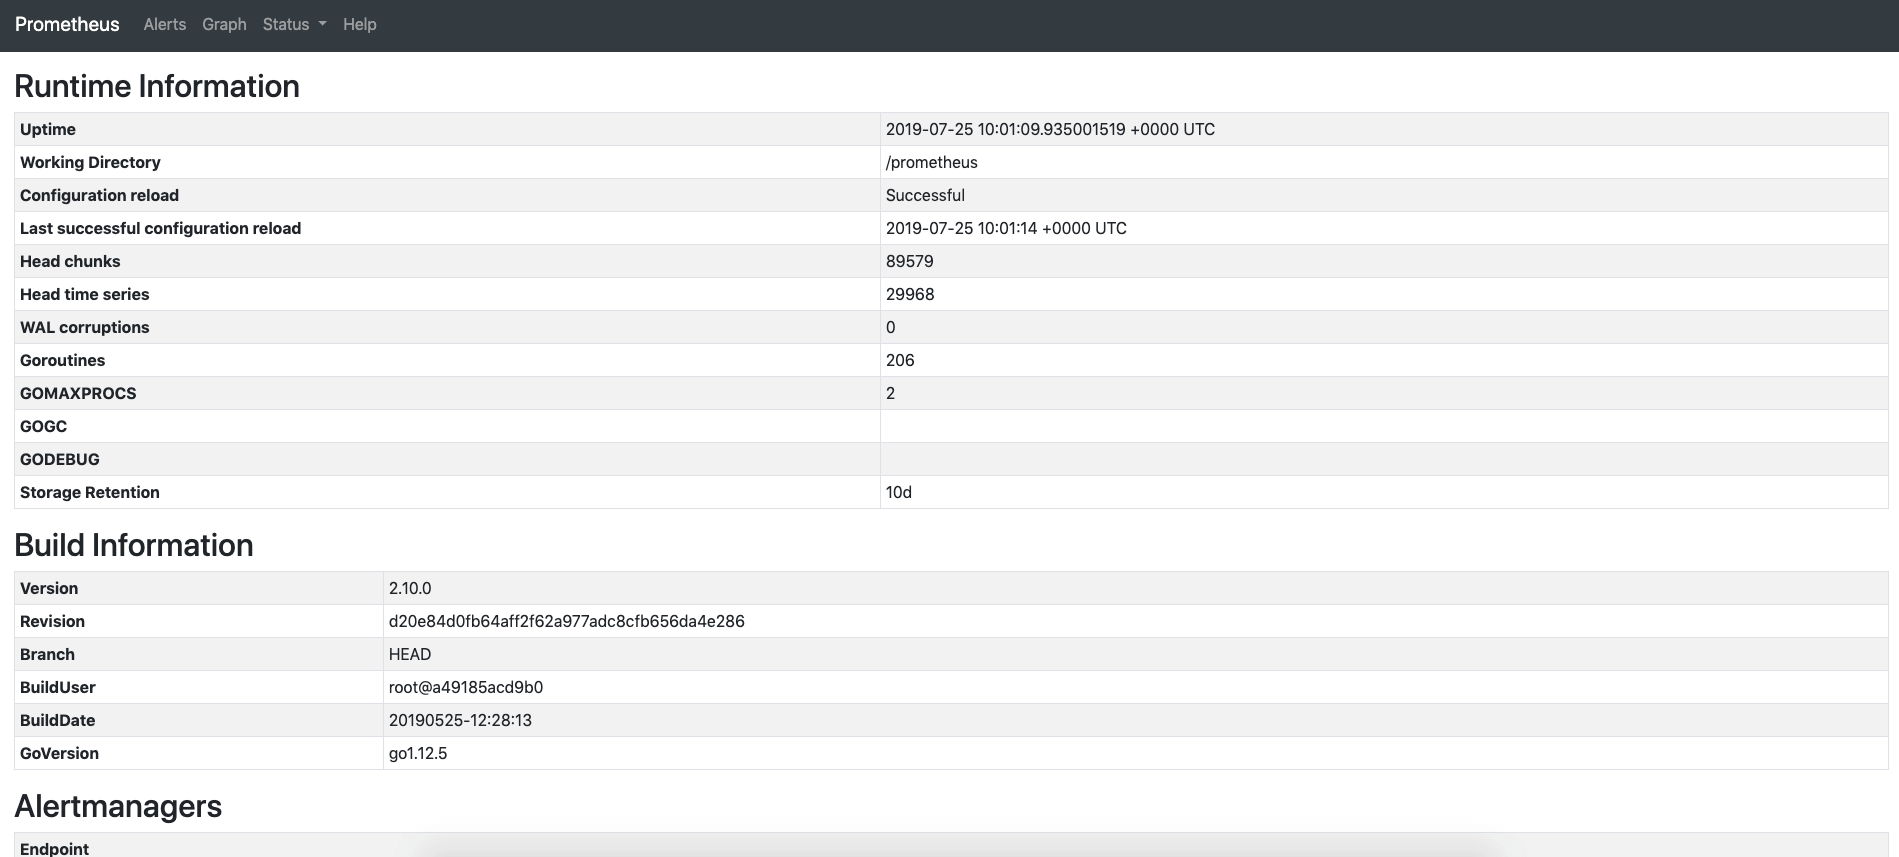
Helm is the package manager for Kubernetes; Operator is used to manage stateful distributed applications on Kubernetes. This article mainly describes how to use Helm and Operator to quickly deploy Prometheus on a Minikube cluster and use Grafana to view monitoring data. For Minikube installation, see Building a Remote Kubernetes Development Environment; for Helm configuration, see The Package Manager for Kubernetes – Helm; for Operator, see Kubernetes Complex Stateful Application Management Framework – Operator.
1. Install Prometheus Operator
1
| helm install --name prometheus-operator --namespace=monitoring stable/prometheus-operator
|
2. Install Prometheus
1
| helm install --name prometheus --set serviceMonitorsSelector.app=prometheus --set ruleSelector.app=prometheus --namespace=monitoring stable/prometheus
|
3. Install Alertmanager
1
| helm install --name alertmanager --namespace=monitoring stable/alertmanager
|
4. Expose the Services
To make Prometheus and Grafana easy to access, we change the Service type to NodePort.
List the services and find the corresponding service names:
1
| kubectl get svc -n monitoring
|
Expose the services:
1
2
| kubectl patch svc prometheus-operator-grafana -p '{"spec":{"type":"NodePort"}}' -n monitoring
kubectl patch svc prometheus-operator-prometheus -p '{"spec":{"type":"NodePort"}}' -n monitoring
|
List the services and find the corresponding access ports:
 1
 2
 3
 4
 5
 6
 7
 8
 9
10
11
12
13
14
15
| kubectl get svc -n monitoring
NAME TYPE CLUSTER-IP EXTERNAL-IP PORT(S) AGE
alertmanager-operated ClusterIP None <none> 9093/TCP,6783/TCP 16h
prometheus-alertmanager ClusterIP 10.98.63.83 <none> 80/TCP 16h
prometheus-kube-state-metrics ClusterIP None <none> 80/TCP 16h
prometheus-node-exporter ClusterIP None <none> 9100/TCP 16h
prometheus-operated ClusterIP None <none> 9090/TCP 16h
prometheus-operator-alertmanager ClusterIP 10.105.201.137 <none> 9093/TCP 16h
prometheus-operator-grafana NodePort 10.110.199.163 <none> 80:32467/TCP 16h
prometheus-operator-kube-state-metrics ClusterIP 10.104.56.81 <none> 8080/TCP 16h
prometheus-operator-operator ClusterIP 10.105.127.162 <none> 8080/TCP 16h
prometheus-operator-prometheus NodePort 10.104.241.128 <none> 9090:32044/TCP 16h
prometheus-operator-prometheus-node-exporter ClusterIP 10.96.160.143 <none> 9100/TCP 16h
prometheus-pushgateway ClusterIP 10.100.107.222 <none> 9091/TCP 16h
prometheus-server ClusterIP 10.107.184.180 <none> 80/TCP 16h
|
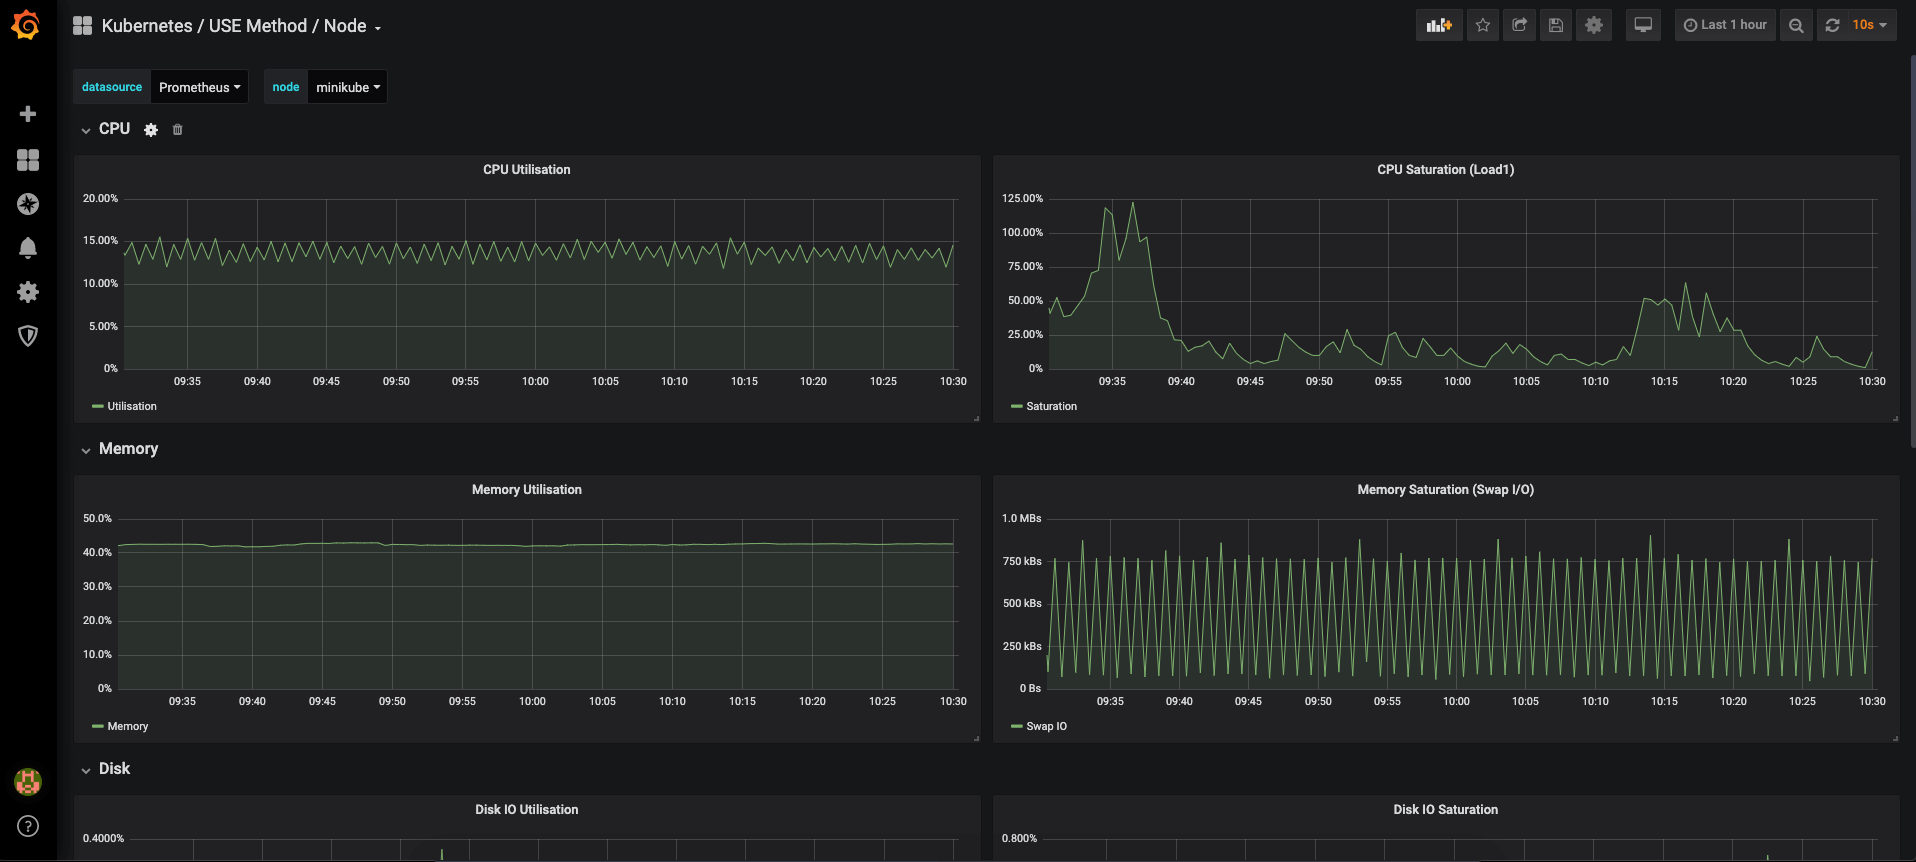
Grafana entry point: http://your_host_ip:32467, Prometheus entry point: http://your_host_ip:32044.
5. Find the admin Account Password
1
| kubectl get secret --namespace monitoring prometheus-operator-grafana -o jsonpath="{.data.admin-password}" | base64 --decode ; echo
|
Grafana page:
Prometheus page: