1. Symptom - Tekton’s Clone Task Is Slow
When running the clone task, Tekton is very time-consuming; with multiple repositories it generally takes around 2 minutes 30 seconds. As shown below:
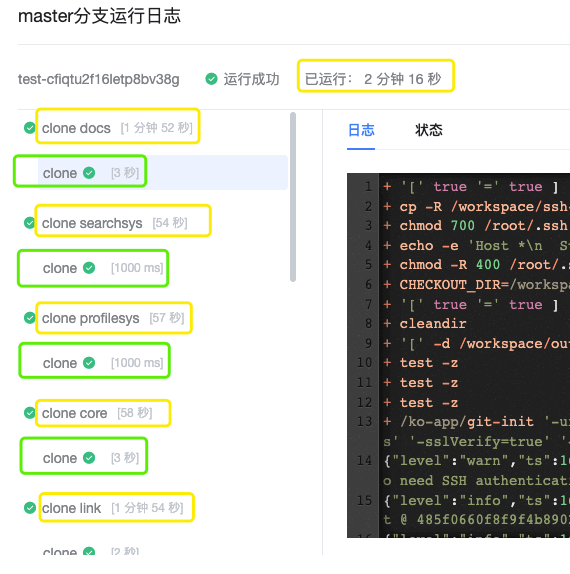
A pipeline that only clones takes 2 minutes 16 seconds to run, while the clone script itself actually runs for only 1-3 seconds. Where is most of the time going? Can it be reduced? That is the main question this post wants to discuss.
2. Analyzing the Time Cost of the Clone Task
When Tekton runs a pipeline, every Task runs in its own separate Pod. In the scenario above, one git clone task clones only one repository, so if there are N code repositories, at least N Pods must be created.
This gives rise to two points for optimization:
- Run tasks in parallel
- Shorten the execution time of a single one
Parallel cloning can be optimized from the operations side; first let’s look at the time sequence of a single Pod execution.
In the example below, the total duration is 34s, the first container takes 29s to start (about 85%), and cloning the code takes only 1s.
| |
In the next example, the total duration is 107s; the first container takes 24s to start (about 22%), the time from the git-init container starting to running the script is 78 seconds (about 72%), and cloning the code takes only 2s.
| |
From the examples above we can see two things:
- From Pod creation to the first container running is very slow, taking about 20-30 seconds
- After git-init starts, the time until the clone script begins running is unstable
So we consider: can we reduce the execution time by speeding up container startup?
3. Using tuned to Set the Host CPU to High-Performance Mode and Speed Up Container Startup
The CICD build uses bare-metal machines, and when they are handed over their CPU working mode is not necessarily set sensibly. The CPU working mode affects the CPU operating frequency and may cause Pods to start slowly[1].
- Check the CPU operating frequency
| |
- Check the CPU working mode
| |
- Switch to the Aliyun Ubuntu mirror
| |
- Install tuned
| |
- Start it and check the status
| |
- Get the current profile
| |
- Set it to the performance profile
| |
The available options are:
latency-performance Latency performance optimization
network-latency Network latency optimization
network-throughput Network throughput optimization
throughput-performance Throughput performance optimization
virtual-guest Virtual machine optimization
virtual-host Virtual machine host optimization
Under throughput-performance the CPU runs at its highest frequency, and a Pod takes 23 seconds to start its first container, a big improvement over the previous 46 seconds.
After setting all machines to the performance profile, extensive testing found that the total duration of code cloning did not drop significantly. The reason is that the build machines are configured as 40C/125GB and already have enough CPU; although the host CPU is in powersave mode, most of its operating frequency is close to the maximum frequency and is not in a very low state. The 46-second-to-23-second improvement above may just have been an occasional effect; running all CPUs at maximum frequency should suppress this kind of fluctuation.
The CPU performance profile is good for speeding up builds and provides a stable response time. In a build environment, it is strongly recommended to enable the CPU performance profile.
4. Tekton Using ReadWriteMany Storage to Improve Parallelism
By default Tekton uses ReadWriteOnce storage, because it is more universal. Using ReadWriteMany requires that the cluster’s storage system supports that mode. Below we test ReadWriteMany using Longhorn as an example:
- Install the NFS Client
Longhorn’s ReadWriteMany volumes depend on the NFS Client.
| |
- When submitting the PipelineRun, set the storage to ReadWriteMany
| |
After testing, we found no significant difference in duration between ReadWriteMany and ReadWriteOnce mode.
The reason is: if multiple Pods are on the same node, ReadWriteOnce mode also allows simultaneous access. ReadWriteOnce, ReadOnlyMany, and ReadWriteMany describe the relationship between a Node and a PV, not the relationship between a Pod and a PV — this may be a point many people overlook. In Kubernetes 1.22+, the newly added ReadWriteOncePod is what targets the Pod-to-PV relationship[2].
Back to the Tekton build scenario: because affinity-assistant is enabled, an entire pipeline executes on a single node, so ReadWriteOnce and ReadWriteMany mode make little difference here.
5. Disabling affinity-assistant to Spread Tasks Across Multiple Nodes
affinity-assistant makes the Pods created by a single pipeline all land on one node. To make Pods start faster, here we try spreading the task of cloning multiple repositories across multiple nodes, to reduce the pressure of IO and Pod creation.
5.1 Disabling Tekton’s affinity-assistant
Edit Tekton’s configuration file[3]:
| |
Set disable-affinity-assistant to true.
Here I found another very useful parameter, pruner, which can automatically clean up taskruns and pipelineruns. This provides great convenience for the operations of a build cluster.
Now the Pods created by the same pipeline are no longer forced to run on one node, but can be spread across other nodes. The pros and cons of doing this are as follows:
Advantages
- Make full use of multiple nodes to create Pods and run tasks
- More room for tuning and customizing Pod scheduling
Disadvantages
- Requires a storage system; hostpath cannot be used
- Increases network traffic between nodes
- May cause failures in passing artifacts between tasks — for example, an image produced by the previous step cannot be found on the host after the next step is scheduled to another node
5.2 Test Verification
- disable-affinity-assistant + ReadWriteOnce — execution time increases noticeably
Below are some captured execution duration data points:
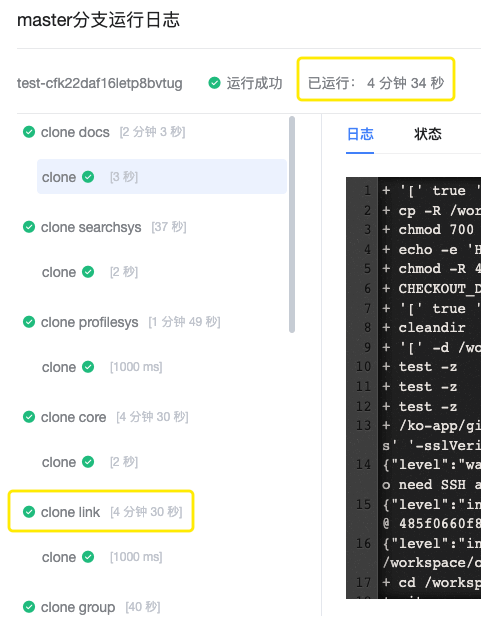
The reason is that after the cloning Pods are spread across multiple Nodes, competition over storage use appears between the Nodes. That is, a task on Node2 has to wait for the task on Node1 to finish before it can execute.
- disable-affinity-assistant + ReadWriteMany — execution time shows no obvious change
Below are some captured execution duration data points:
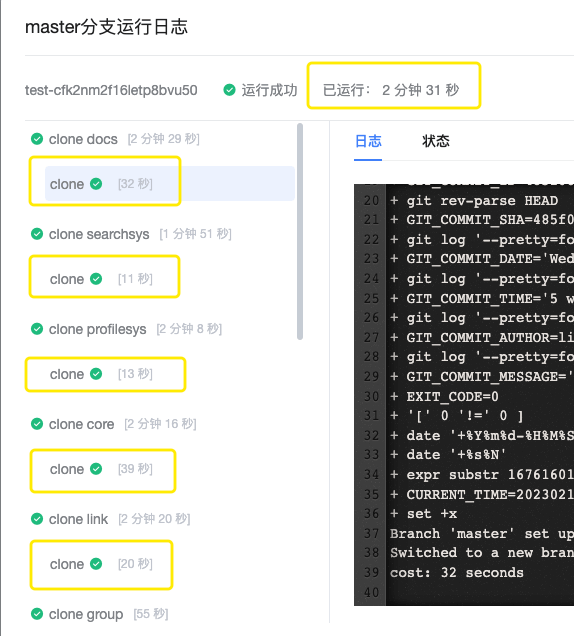
In ReadWriteMany mode, Pods on different Nodes can use the storage at the same time, but this adds extra network overhead. One gain and one loss cancel out, so the overall execution time does not fluctuate much. Data obtained from Pod Status and Logs also confirms the above view. The following is the execution timeline:
| |
Creating the container took only 18 seconds, but the clone script’s execution time averaged over 10 seconds, a clear increase.
For the storage part, there is another optimization: using Longhorn’s strict-local mode. Edit Longhorn’s configuration file:
| |
Set numberOfReplicas to 1 and dataLocality to strict-local. strict-local is a new feature provided by Longhorn 1.4; it uses a local Unix Socket to proxy IO operations directly rather than going over network TCP. But in the build scenario, testing showed this is not the bottleneck here.
6. Optimizing Etcd to Speed Up Cluster Response
While looking at the system’s various components, Etcd’s logs caught my attention.
6.1 Migrating Etcd to a Faster Disk to Reduce Latency
- A large number of etcd warning logs
| |
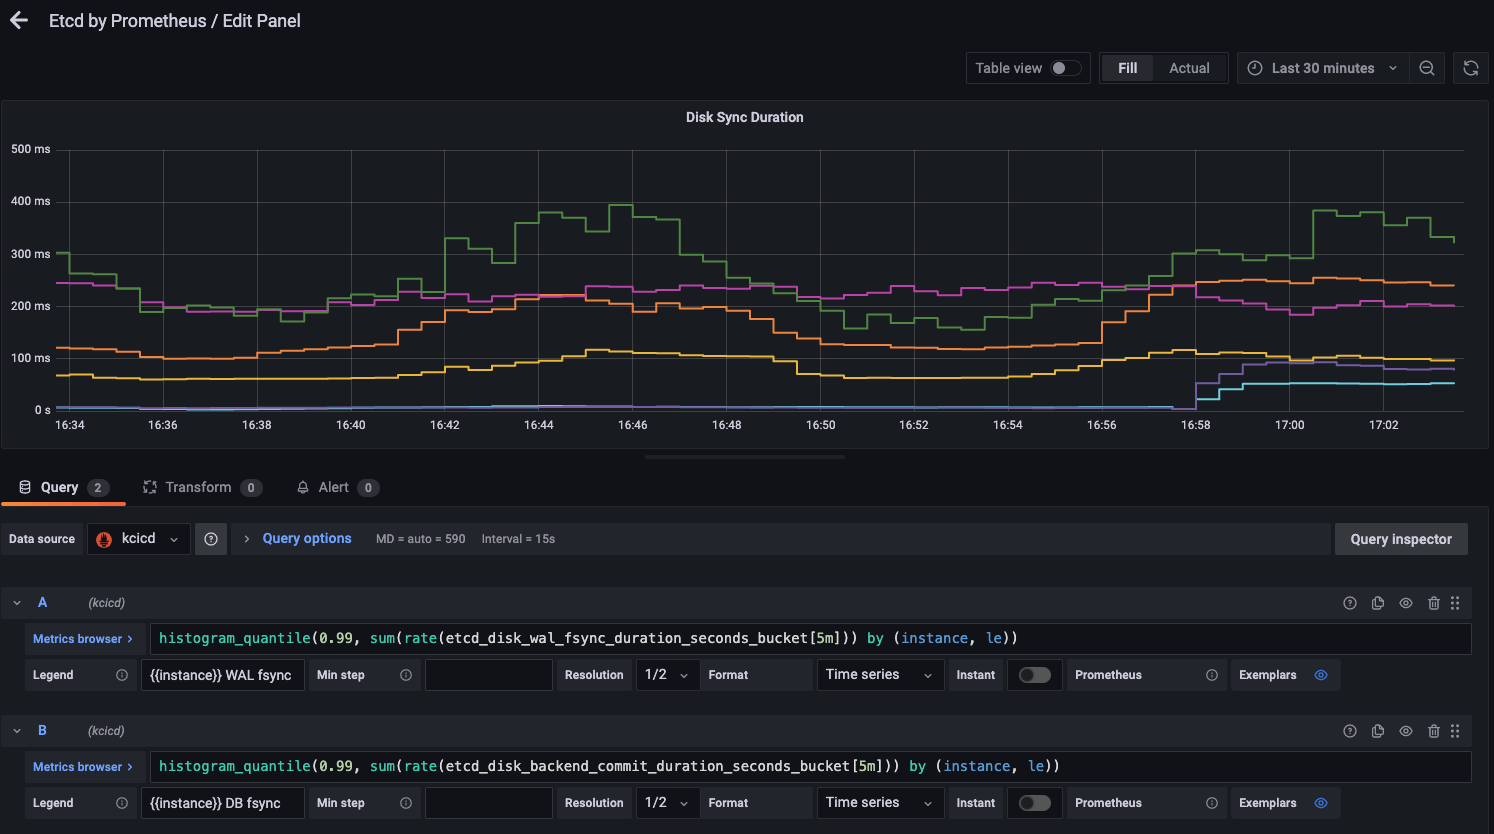
- Monitoring shows Etcd’s disk latency is very high, close to 200ms
- Stop the Etcd service
| |
- Update the Etcd data directory
| |
The /data directory is mounted on an SSD, while /var/lib/ is the system disk HDD.
- Migrate the data
| |
- Start Etcd
| |
- After using the SSD, Etcd’s disk latency dropped somewhat, to close to 100ms, but it is still far from the target of under 25ms
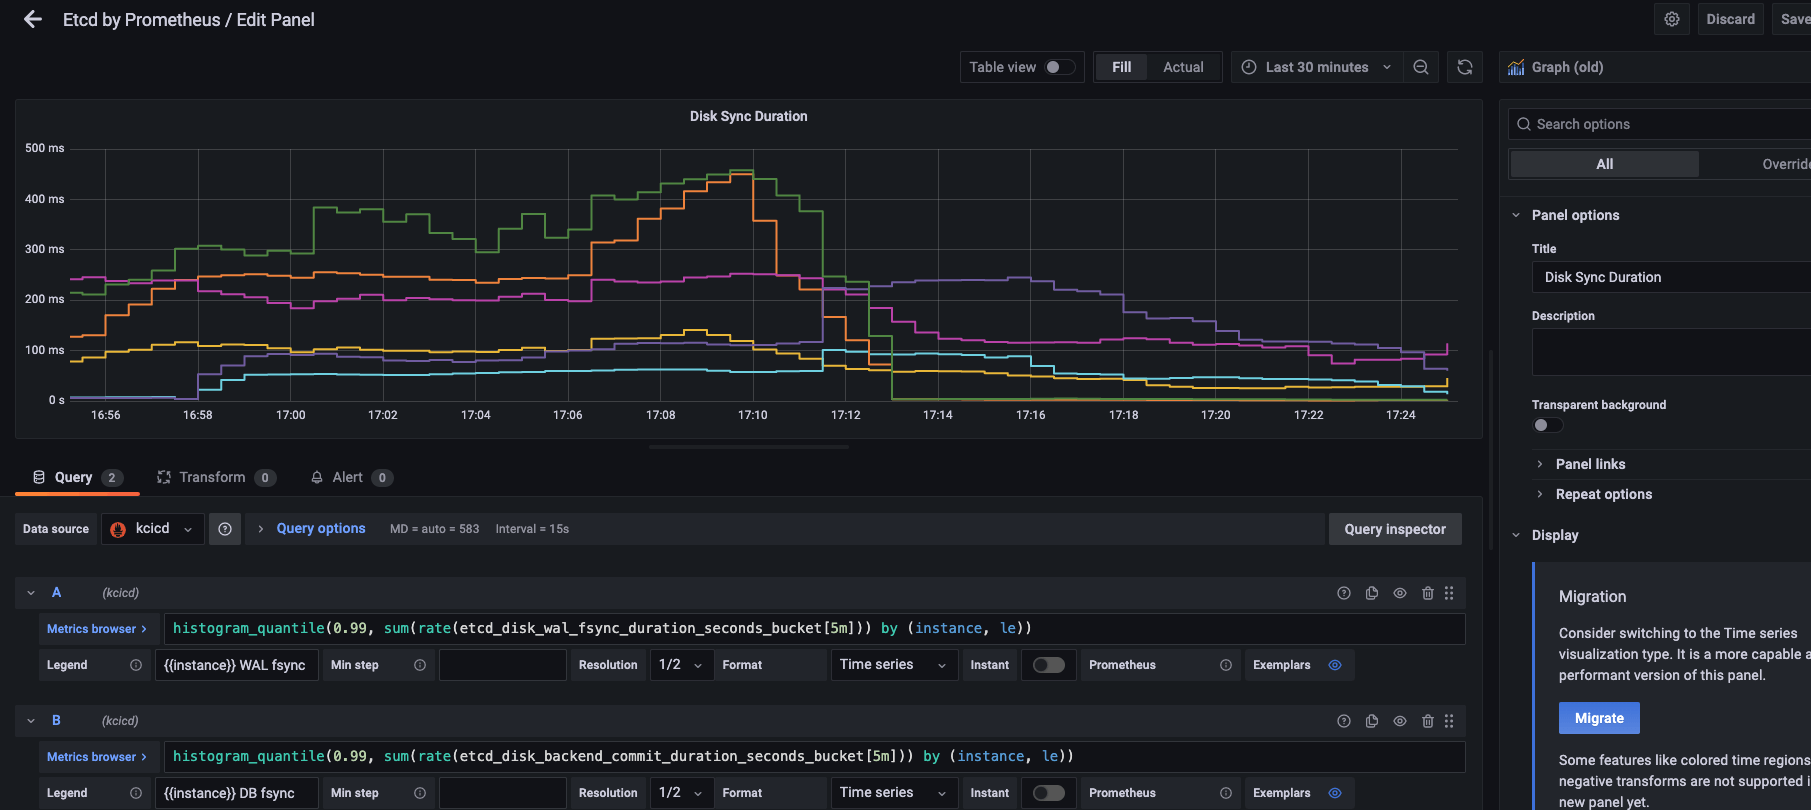
Another possible cause is that kube-status-metrics had labels and annotations collection enabled, raising the pressure on kube-apiserver. So I turned off kube-state-metrics and observed the Etcd metrics again, but saw no obvious optimization effect.
6.2 Raising the IO Priority of the Etcd Process
Continuous integration is extremely CPU-, Mem-, IO-, and Network-intensive, and Tekton’s underlying runtime is Kubernetes, while Etcd is Kubernetes’ storage core. Therefore it is necessary to keep the Etcd process at the highest priority, to reduce time consumed by the management plane.
| |
6.3 Splitting Event Events into a New Etcd Cluster
- Deploy Etcd
What is special here is that I used a cluster deployed by Kubekey, and the default Etcd certificate already includes all cluster node IPs. Therefore I directly copied one of the Etcd nodes to a new node to run a new Etcd cluster, modifying ETCD_INITIAL_CLUSTER_STATE=new was enough.
Otherwise, if the Etcd cluster uses a TLS connection, you may have to regenerate and update the Etcd certificate in kube-apiserver.
- Edit kube-apiserver on all master nodes and add the etcd configuration
| |
Add the following configuration[4]
| |
Wait for kube-apiserver to finish restarting.
- Check node status in the new Etcd cluster
| |
If you see DB SIZE continuously increasing, that means Event events have been split off to the new Etcd cluster.
- Check the optimization effect
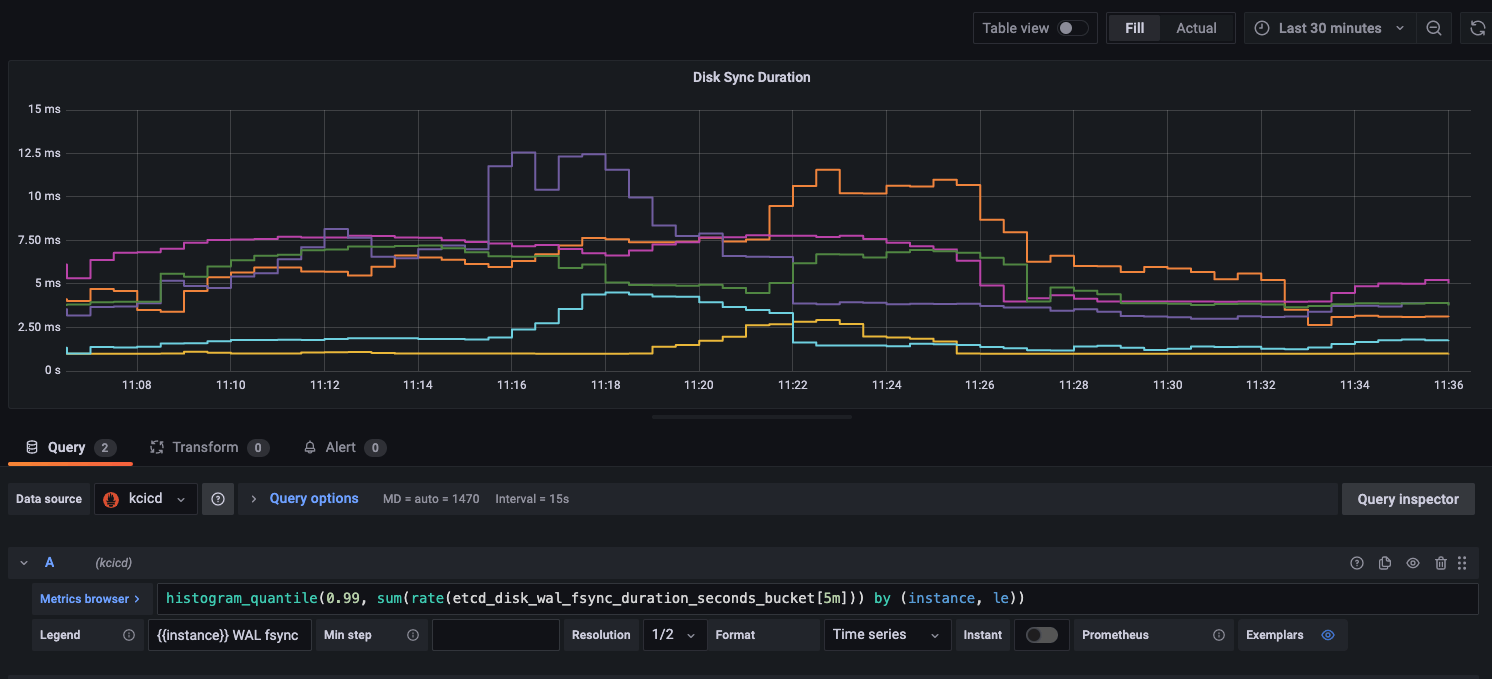
This is a monitoring screenshot during working hours. Somewhat hard to believe, after the SSD and stripping out Event events, Etcd’s disk latency was only 10 ms.
But the Etcd part of the optimization probably has only a 1-2 second effect on build duration, which is far from the ideal result. After analyzing Kubelet logs and source code, using NFS turned out to be a good optimization point.
7. Using NFS Storage Can Effectively Speed Up the Creation of Pods with Storage Volumes
At creation time, if there is a dependency on storage, the Pod will keep waiting, which causes slow container creation. Below is a simplified example, where nodeName pins the node to avoid interference from cluster scheduling; and imagePullPolicy is set to IfNotPresent to avoid interference from image pulling.
- A workload without storage
| |
Below is the time sequence:
| |
With the image already pulled in advance, starting the first container took 1 second.
- A workload with storage
| |
Below is the time sequence:
| |
The process for a Pod to use a PV is as follows[5]; the timestamps were mainly derived from Kubelet and iscsid logs:
- The storage component creates the pv -> 09:55:12
- attach mounts it to the Node where the Pod is -> 09:55:14(iscsi connected)-09:55:25(kubelet attached)
- mount mounts it into the Pod -> 09:55:26
You can see that attach takes far too long, so we switched to NFS, which needs no attach, as the backend storage.
After testing, this yielded about a 21-second speedup.
From the original execution durations:
2 minutes 13 seconds, 2 minutes 34 seconds, 2 minutes 37 seconds, 2 minutes 28 seconds, 2 minutes 25 seconds
Shortened to:
1 minute 58 seconds, 2 minutes 20 seconds, 2 minutes 16 seconds, 1 minute 58 seconds, 2 minutes 1 second
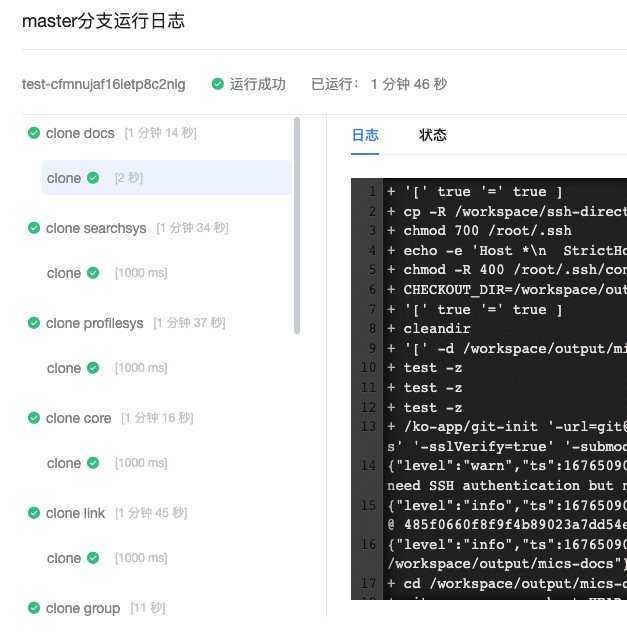
After also combining it with disable-affinity-assistant, we save roughly another 10-20 seconds. The figure below shows the test data:
8. Summary
Lately I have been trying to optimize the slow build problem from an operations perspective.
This post is about optimizing Tekton’s slow clone task. By using NFS storage, we can reduce Kubelet’s Pod creation time by about 20 seconds; disabling the affinity-assistant feature spreads the Pods of a single pipeline across multiple nodes, which reduces startup time by roughly another 10-20 seconds. Because the test data set is limited, the effect observed so far is that a clone pipeline that previously took 2 minutes 30 seconds can now finish within 2 minutes — about a 30-second improvement. Of course, a faster build approach is to clone multiple repositories in one Pod and keep the PV from being destroyed, but that change is too large and is outside the scope of this operations optimization.
The main points of this post are as follows:
- The CPU high-performance mode helps Pods start quickly
- ReadWriteOnce and ReadWriteMany describe the relationship between a Pod and a Node; in ReadWriteOnce mode, multiple Pods on the same Node can use the PV at the same time
- A Pod with a storage volume starts much more slowly than one without storage, by roughly 10-plus seconds
- Under Tekton’s default configuration, a pipeline can only build on one node; the
disable-affinity-assistantparameter disables this behavior and increases the parallelism of parallel tasks - Using an SSD and splitting out Event can significantly reduce Etcd’s disk pressure and improve response speed
- With NFS, a Pod with a storage volume is created noticeably faster than with OpenEbs or Longhorn
9. References
- https://zhangguanzhang.github.io/2019/04/28/k8s-java-start-time-not-same/
- https://kubernetes.io/zh-cn/docs/concepts/storage/persistent-volumes/#access-modes
- https://tekton.dev/docs/operator/tektonconfig/
- https://imroc.cc/kubernetes/best-practices/ops/etcd-optimization.html
- https://www.lixueduan.com/posts/kubernetes/14-pv-dynamic-provision-process/
