1. Kubectl Basic Commands
1.1 Creating Objects
1
2
3
4
5
6
7
8
| # Create resources; a remote URL also works
kubectl create -f ./my.yaml
# Create resources from multiple files
kubectl create -f ./my1.yaml -f ./my2.yaml
# Create resources using all manifest files in a directory
kubectl create -f ./dir
# Start an nginx instance
kubectl run nginx --image=nginx
|
1.2 Displaying and Finding Resources
1
2
3
4
5
6
7
8
| # List services in all namespaces
kubectl get services
# List pods in all namespaces
kubectl get pods --all-namespaces
# List pods in kube-system
kubectl get pods -n kube-system
# List all pods with detailed information
kubectl get pods -o wide
|
1.3 Updating Resources
 1
 2
 3
 4
 5
 6
 7
 8
 9
10
| # Rolling update of pod frontend-v1
kubectl rolling-update frontend-v1 -f frontend-v2.json
# Update the resource name and the image
kubectl rolling-update frontend-v1 frontend-v2 --image=image:v2
# Update the image in the frontend pod
kubectl rolling-update frontend --image=image:v2
# Force replacement: delete and recreate the resource. This causes service interruption.
kubectl replace --force -f ./pod.json
# Create a service for the nginx RC, mapping local port 80 to port 8000 on the container
kubectl expose rc nginx --port=80 --target-port=8000
|
1.4 Deleting Resources
 1
 2
 3
 4
 5
 6
 7
 8
 9
10
| # Delete the pod of the type and name defined in pod.json
kubectl delete -f ./pod.json
# Delete the pod named "baz" and the service named "foo"
kubectl delete pod, service baz foo
# Delete pods and services with the label name=myLabel
kubectl delete pods, services -l name=myLabel
# Delete pods and services with the label name=myLabel, including uninitialized ones
kubectl delete pods, services -l name=myLabel --include-uninitialized
# Delete all pods and services in the my-ns namespace, including uninitialized ones
kubectl -n my-ns delete po,svc --all
|
1.5 Interacting with Running Pods
 1
 2
 3
 4
 5
 6
 7
 8
 9
10
| # Stream a pod's logs (stdout
kubectl logs -f my-pod
# Stream the logs of a container in a pod (stdout; use when the pod has multiple containers)
kubectl logs -f my-pod -c my-container
# Run a pod as an interactive shell
kubectl run -i --tty busybox --image=busybox -- sh
# Attach to a running container
kubectl attach my-pod -i
# Execute a command in an existing container (when the pod has multiple containers)
kubectl exec my-pod -c my-container -- ls /
|
2. Dashboard Introduction
Kubernetes Dashboard is a fully featured web interface for managing a Kubernetes cluster, designed to fully replace command-line tools (kubectl, etc.) with a UI.
On the Dashboard page you can view the cluster state of Kubernetes and perform related operations on the cluster. However, the Dashboard cannot graphically display cluster metric information; the Heapser plugin must be installed.
Below, let’s look at Kubernetes’ monitoring system and try configuring monitoring.
3. Monitoring System
The architecture diagram is as follows:
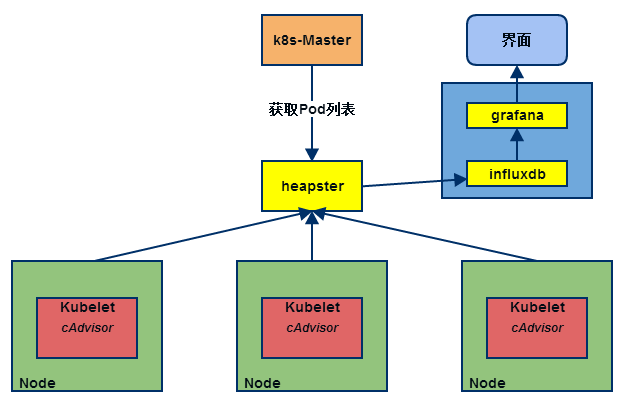
- cAdvisor is the container resource collection tool built into Kubelet. It automatically collects the CPU, memory, network, and filesystem resource usage of containers on the local host and exposes an API.
- InfluxDB is an open-source distributed time-series, event, and metrics database.
- Grafana is the Dashboard for InfluxDB and provides powerful charting capabilities. It is often used together with InfluxDB to display charted monitoring data.
- Heapster provides resource monitoring for the entire cluster and supports persisting data to backends such as InfluxDB.
- kube-state-metrics: beyond configuring cAdvisor, Heapster, Influx, and Grafana, you can also consider deploying kube-state-metrics. kube-state-metrics polls the Kubernetes API for how many replicas are scheduled, how many are currently available, how many Pods are in the running, stopped, or terminated state, and how many times a Pod has restarted.
4. Configuring Monitoring
Get the official configuration yaml:
1
2
3
4
5
6
| git clone https://github.com/kubernetes/heapster.git
# List the yaml configuration files
ls -l deploy/kube-config/influxdb/
grafana.yaml
heapster.yaml
influxdb.yaml
|
Heapster, InfluxDB, and Grafana all start and run as Pods; create the Pods:
1
2
3
4
5
6
7
8
| kubectl create -f deploy/kube-config/influxdb/
deployment.extensions/monitoring-grafana created
service/monitoring-grafana created
serviceaccount/heapster created
deployment.extensions/heapster created
service/heapster created
deployment.extensions/monitoring-influxdb created
service/monitoring-influxdb created
|
It may take a few minutes before the Pods reach the Running state:
1
2
3
4
5
| kubectl get pods -n kube-system
NAME READY STATUS RESTARTS AGE
heapster-7ff8d6bf9f-ngb9p 1/1 Running 0 31m
monitoring-grafana-68b57d754-4qwjm 1/1 Running 0 31m
monitoring-influxdb-cc95575b9-5j556 1/1 Running 0 31m
|
After the configuration is complete, the Dashboard still does not show CPU, memory, and other information; check the Heapser log:
1
2
| kubectl logs -f heapster-7ff8d6bf9f-ngb9p -n kube-system
1 reflector.go:190] k8s.io/heapster/metrics/util/util.go:30: Failed to list *v1.Node: nodes is forbidden: User "system:serviceaccount:kube-system:heapster" cannot list nodes at the cluster scope
|
It reports a missing role and no access permission. Add the authorization:
1
2
| kubectl create -f deploy/kube-config/rbac/heapster-rbac.yaml
clusterrolebinding.rbac.authorization.k8s.io/heapster created
|
Update Heapser:
1
| kubectl replace --force -f deploy/kube-config/influxdb/heapster.yaml
|
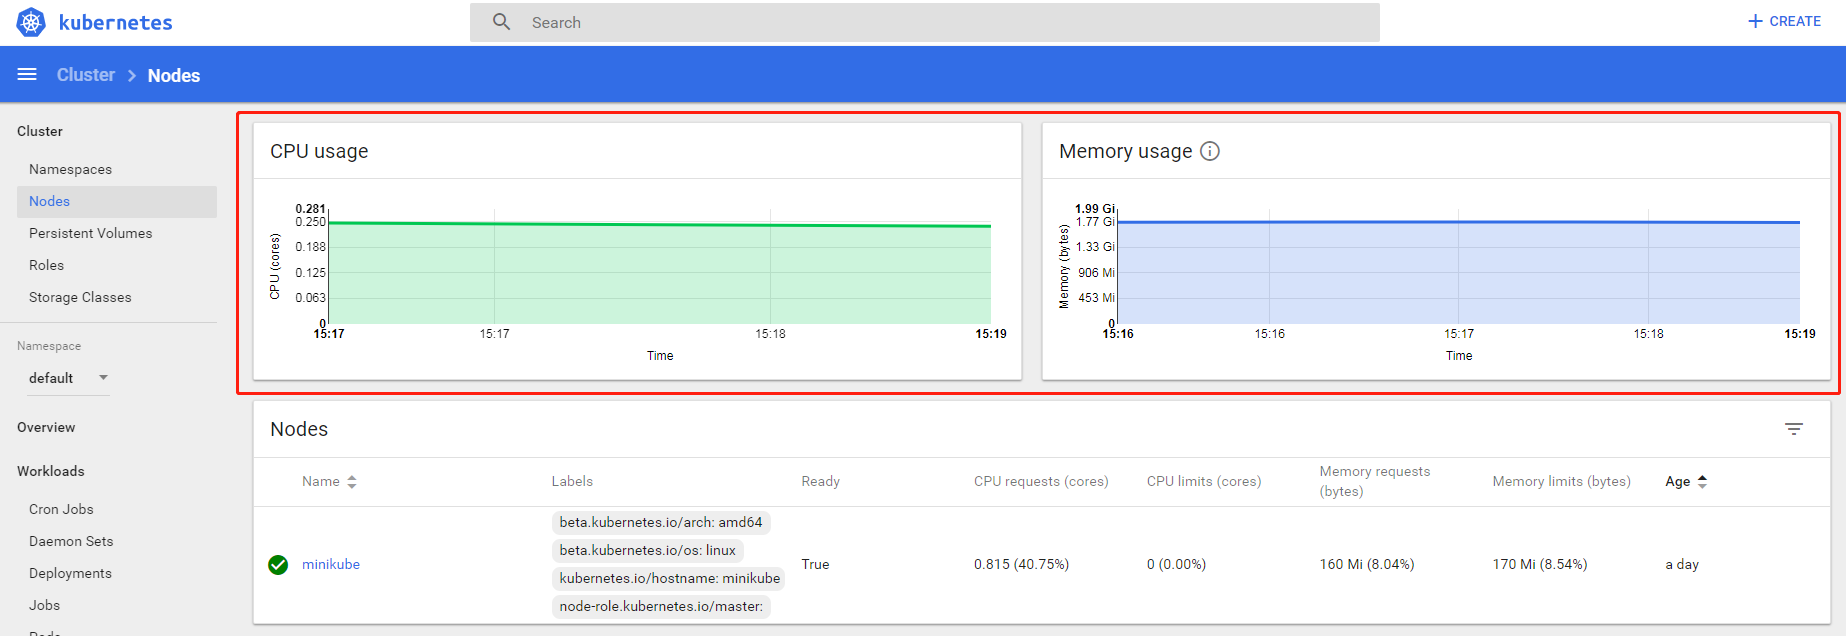
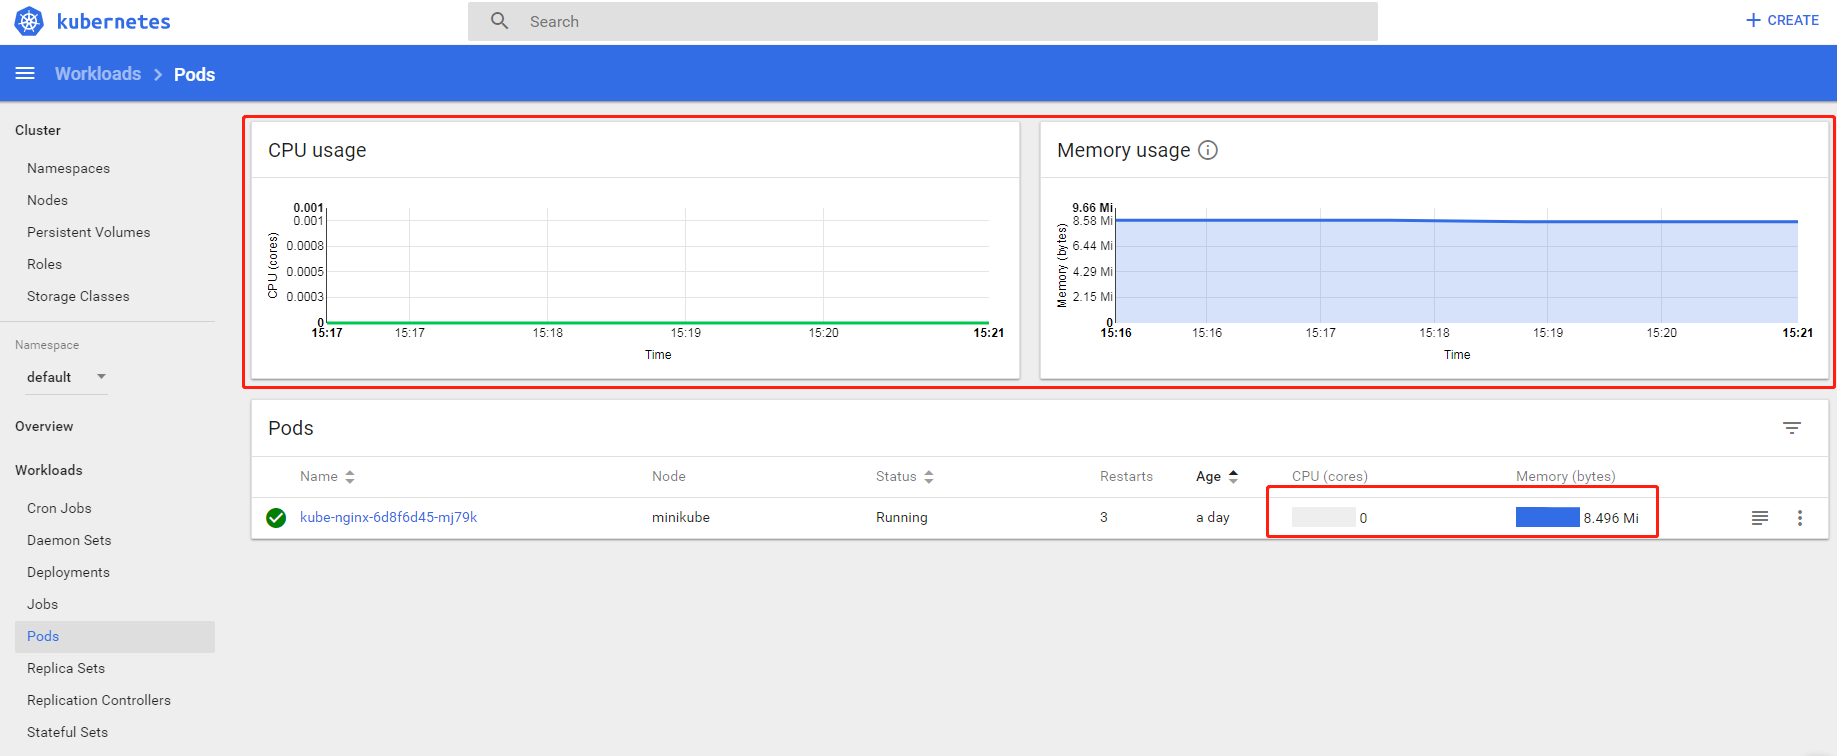
Looking at the Dashboard again, you can see CPU and MEM usage very clearly in Nodes and Pods.
5. Stress Testing
Below, using the ab tool provided by Apache, we run a simple stress test experiment against an Nginx service hosted by Kubernetes.
5.1 Installing Apache
Apache can be installed with Chocolatey, or with the official Windows installer.
1
| choco install apache-httpd
|
5.2 Running the Test
Hardware configuration:
- CPU, i7-4790, 3.6G, 4 cores 8 threads
- MEM, 16 GB
- VirtualBox, 5.2.8
2 CPU cores and 2 GB MEM allocated to the minikube VM.
Software versions:
- Windows 7
- Minikube 0.28.2
- Nginx 1.15.4
- ApacheBench 2.3
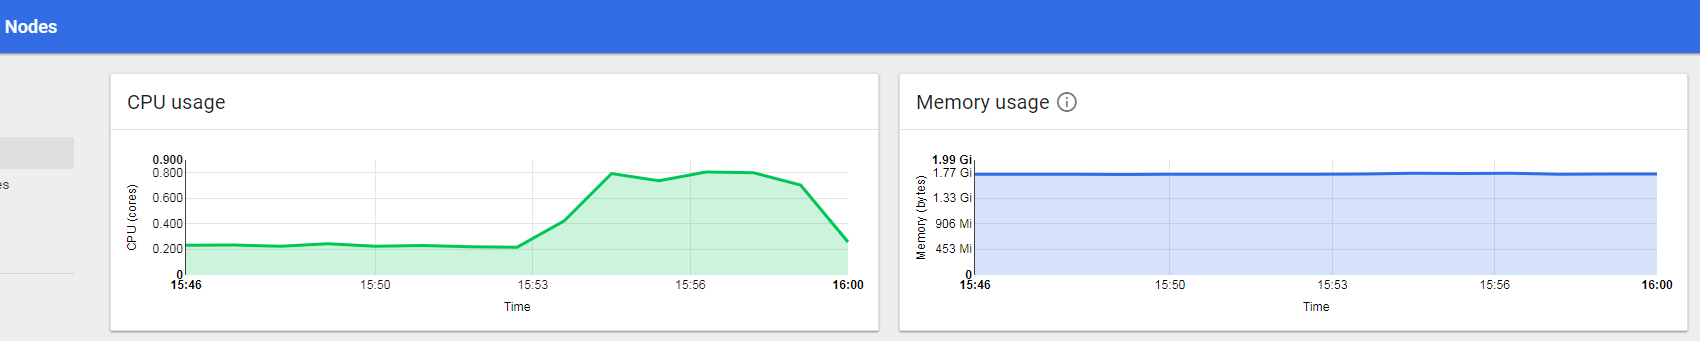
After the stress test starts, CPU and memory usage can also be seen rising sharply in the Dashboard.

 1
 2
 3
 4
 5
 6
 7
 8
 9
10
11
12
13
14
15
| ab -c 125 -n 400000 http://192.168.99.100:31925/
// number of concurrent requests
Concurrency Level: 125
// total duration of the test
Time taken for tests: 317.350 seconds
// number of completed requests
Complete requests: 400000
// number of failed requests
Failed requests: 0
// throughput
Requests per second: 1260.44 [#/sec] (mean)
// average request wait time per user
Time per request: 99.172 [ms] (mean)
// average server-side request processing time
Time per request: 0.793 [ms] (mean, across all concurrent requests)
|
One Pod
| Concurrent requests | 125 | 250 | 500 | 1000 |
|---|
| Duration (second) | 317 | 265 | 313 | 338 |
| Throughput (/second) | 1260 | 1508 | 1276 | 1182 |
| Average request wait time (ms) | 99 | 165 | 391 | 845 |
| Average server processing time (ms) | 0.79 | 0.66 | 0.78 | 0.845 |
Two Pods
| Concurrent requests | 125 | 250 | 500 | 1000 |
|---|
| Duration (second) | 329 | 311 | 337 | 375 |
| Throughput (/second) | 1213 | 1284 | 1186 | 1065 |
| Average request wait time (ms) | 102 | 194 | 421 | 938 |
| Average server processing time (ms) | 0.824 | 0.778 | 0.843 | 0.939 |
From the tables above we can see that, under a given hardware environment, for the Nginx service:
- Increasing the number of Pods does not significantly improve service quality (throughput and user wait time)
6. References
