1. What Needs Dial Testing
GPT was all the rage this year, and I deployed and developed several applications and mini programs to learn from. Of course, following the principle of helping vendors test their features, right now only the GPT 3.5 API costs a little every day — the server, database, and bandwidth are all free.
To save cost, I have no test environment: every time I commit code, as long as it compiles successfully I publish it straight to production. Golang applications are a bit better — if it compiles, there is usually not much to worry about. Python applications are a nightmare: without unit tests it is very easy to hit an error, and after committing you just get a 500. So there is an urgent need to monitor whether a service is misbehaving and to guarantee its availability.
Dial testing uses monitoring points distributed across the whole network to periodically monitor the availability, response latency, and other aspects of a specified service. That is exactly the capability I needed.
2. Why Upptime
The free tiers offered by domestic vendors are all too small. Even Alibaba Cloud Dial Testing, which has the largest free quota, is only enough for one monitoring point to monitor one service address every 5 minutes.
I saw that some independent sites use the uptime-kuma project, an open-source GitHub project at https://github.com/louislam/uptime-kuma . The resulting monitoring looks good, the presentation is very clear, and it also supports various alert notification channels. But deploying uptime-kuma requires mounting a local disk or using MySQL to store data. For people who have not bought a server, that makes the cost a little high.
At this point the Upptime project entered the candidate list. Upptime is also an open-source GitHub project at https://github.com/upptime/upptime . Upptime works by using GitHub Actions to run scripts on a schedule, storing the monitoring results in a GitHub repository, and filing and managing alerts as Issues. That way no extra server or data storage is needed — similar to a project I developed earlier, https://github.com/shaowenchen/debugger-action , which uses GitHub Actions resources to run a Kubernetes cluster for free for 6 hours.
Using GitHub Actions to provide compute and GitHub Repositories and Issues to store data makes the cost for the user zero. As long as you do not abuse it — for example, for mining, very high-frequency use, or large-scale data storage — GitHub will not ban your account.
3. Building a Dial Testing Service with Upptime
3.1 Creating a New Repository from the Upptime Project Template
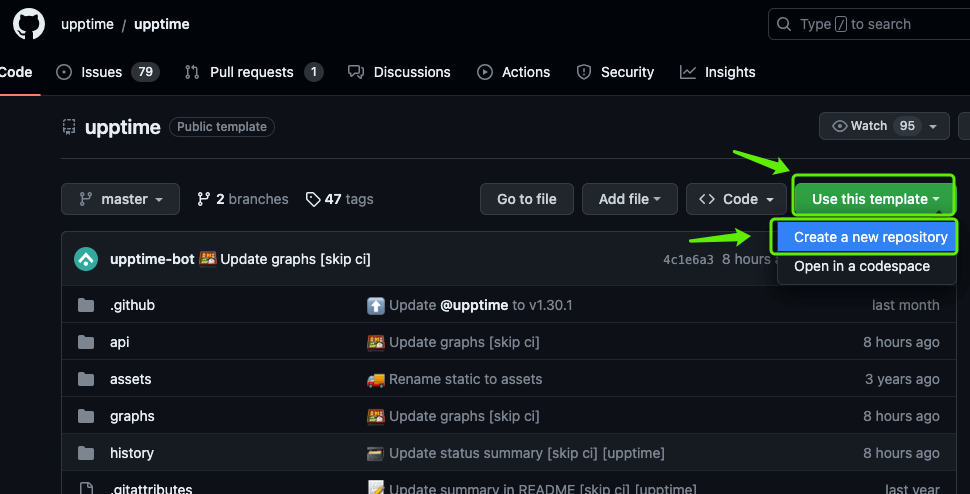
Open the project https://github.com/upptime/upptime
Click [Use this template] and choose [Create a new repository]
- Check [Include all branches] and enter the repository name
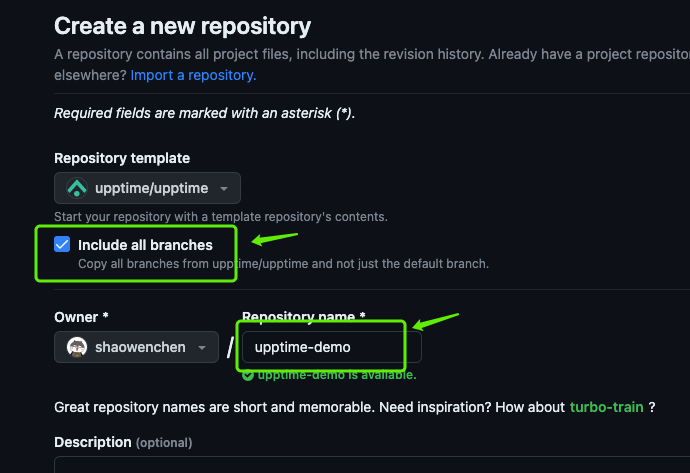
- Click create and wait for it to finish
3.2 Configuring Credentials for Updating the Repository
- Create a new Personal access token, used to update the repository
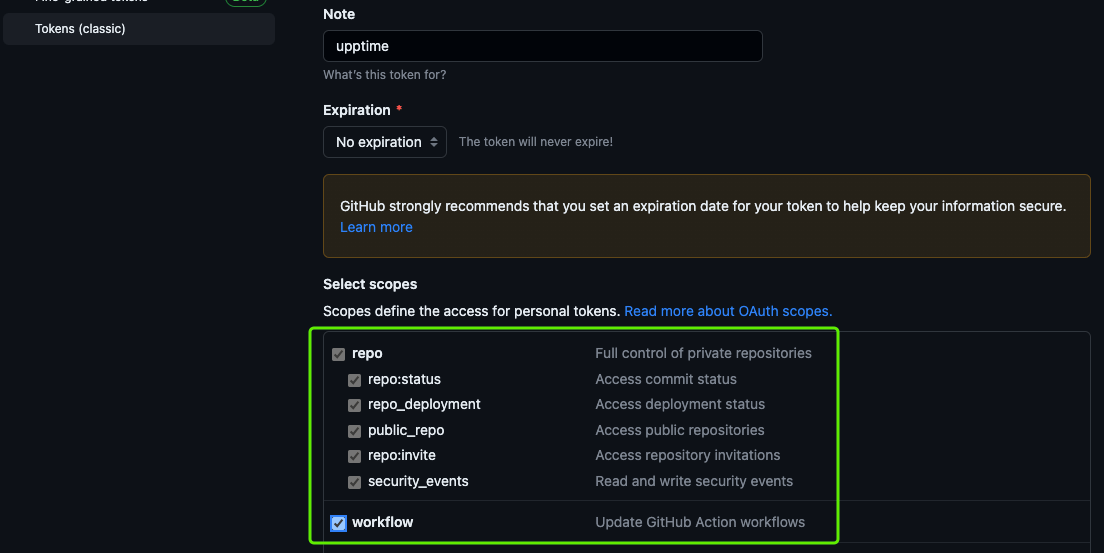
Open the page https://github.com/settings/tokens/new
Check the [repo] and [workflow] scopes, click [Generate token] to generate a new token, as shown below:
- In the repository just created, set up Secrets
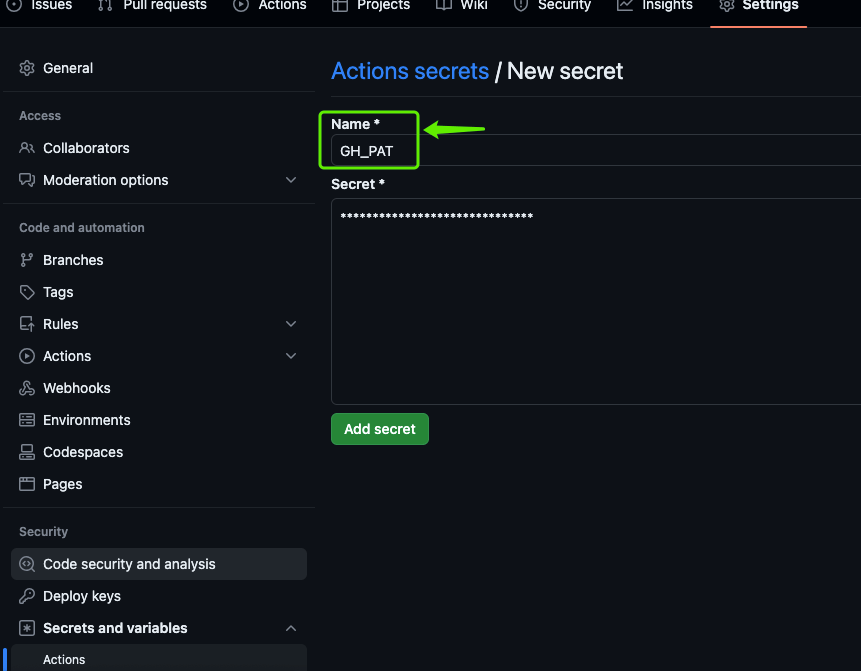
Taking the shaowenchen/upptime repository I created as an example, go to https://github.com/shaowenchen/upptime/settings/secrets/actions
Click [New repository secret] to add a secret named GH_PAT whose value is the Personal access token you just created, as shown below:
3.3 Editing the Configuration File to Add Monitored Services
Upptime’s configuration file is .upptimerc.yml, in the repository root. A few key configuration items are explained below; for the rest you can refer to https://upptime.js.org/docs/configuration
- Set the repository owner and repo
| |
- Set the repository CNAME, for a custom domain
By default Upptime uses the domain https://<owner>.github.io/<repo>. If you need a custom domain, you can set a CNAME, as shown below.
| |
- Set the services to monitor
| |
Here maxResponseTime sets the response time threshold; exceeding this threshold triggers an alert. expectedStatusCodes sets the expected response status codes; a status code that is not one of the expected ones also triggers an alert.
There are two rather special settings above:
- “tcp-ping” defines a TCP monitoring check, used to monitor whether a port is available
$WWW_URLretrieves the monitored service’s address from an environment variable, in order to hide the service address
When configuring GitHub Actions, there is an interesting pattern in .github/workflows/uptime.yml:
| |
SECRETS_CONTEXT is an environment variable that puts all the variables defined in secrets directly into the current environment.
So in the configuration example above, we only need to define a WWW_URL variable in secrets, and then we can reference this variable in the configuration file with $WWW_URL — very convenient.
4. Configuring Alert Notifications
For Upptime’s alert configuration you can refer to https://upptime.js.org/docs/notifications . Here I mainly use SendGrid email alerts as an example to explain how to configure it.
4.1 Create a SendGrid Sender Authentication
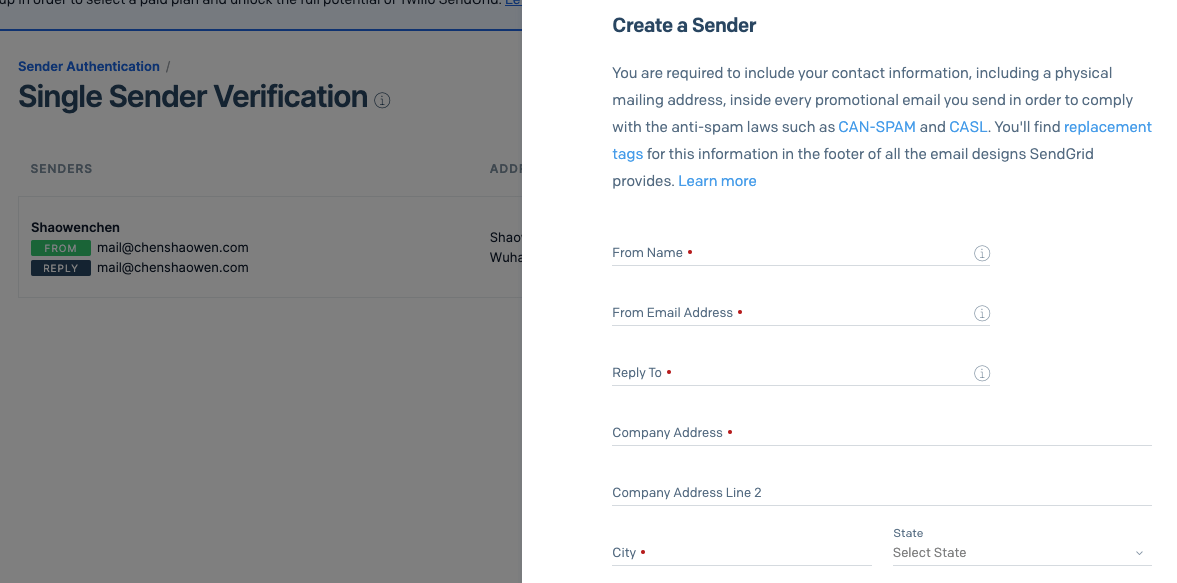
Go to https://app.sendgrid.com/settings/sender_auth , choose [Single Sender Verification], click [Create Sender], and enter a set of information to verify the email address, as shown below:
4.2 Create a SendGrid API Key
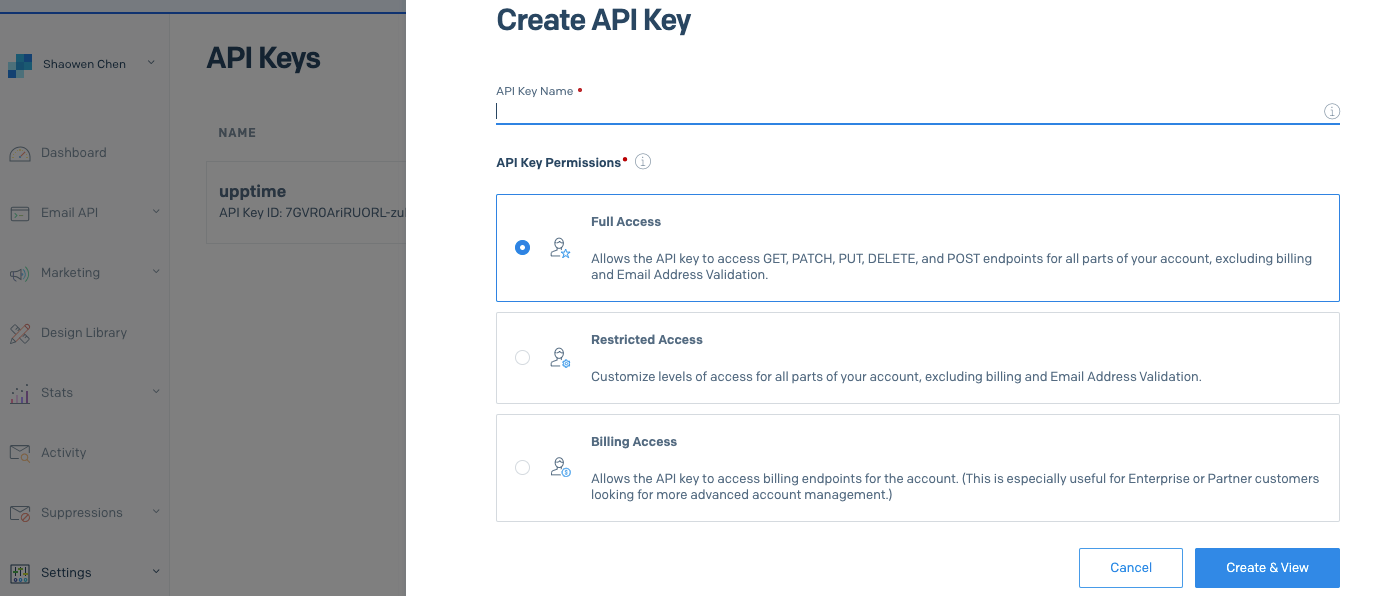
Go to https://app.sendgrid.com/settings/api_keys , choose [Create API Key], enter a name, choose [Full Access], and click [Create & View], as shown below:
4.3 Configure SendGrid Parameters in GitHub Secrets
The parameters that must be set for email are:
| |
| |
5. Verification and Summary
5.1 Verification
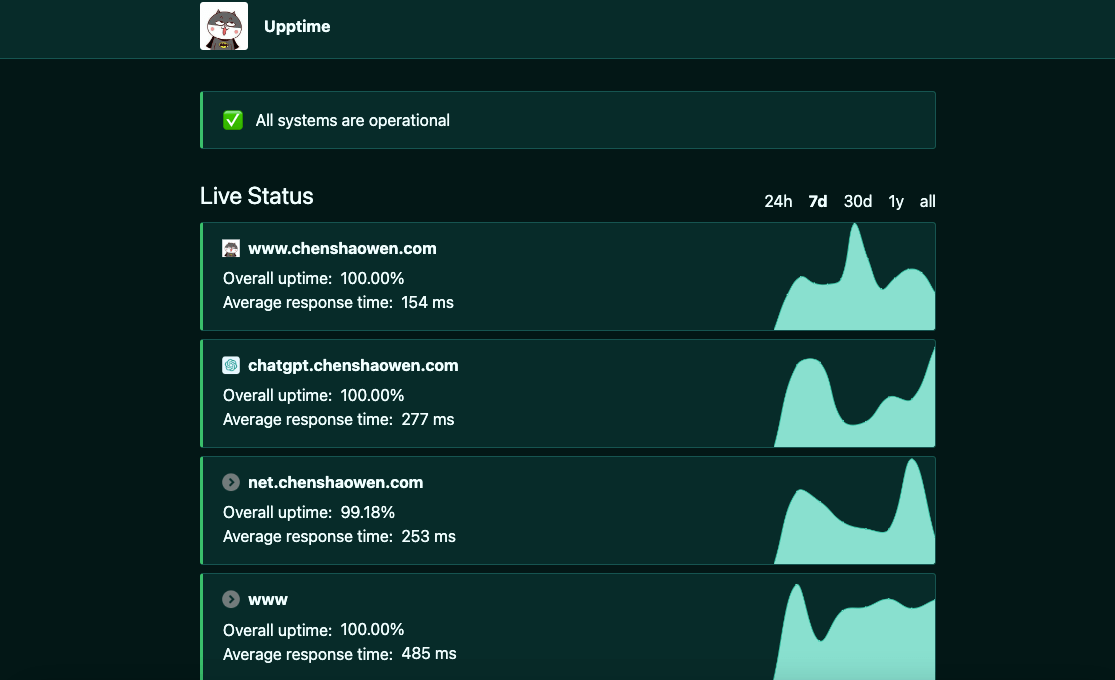
Open the site https://upptime.chenshaowen.com/ and you can see the monitoring results, as shown below:
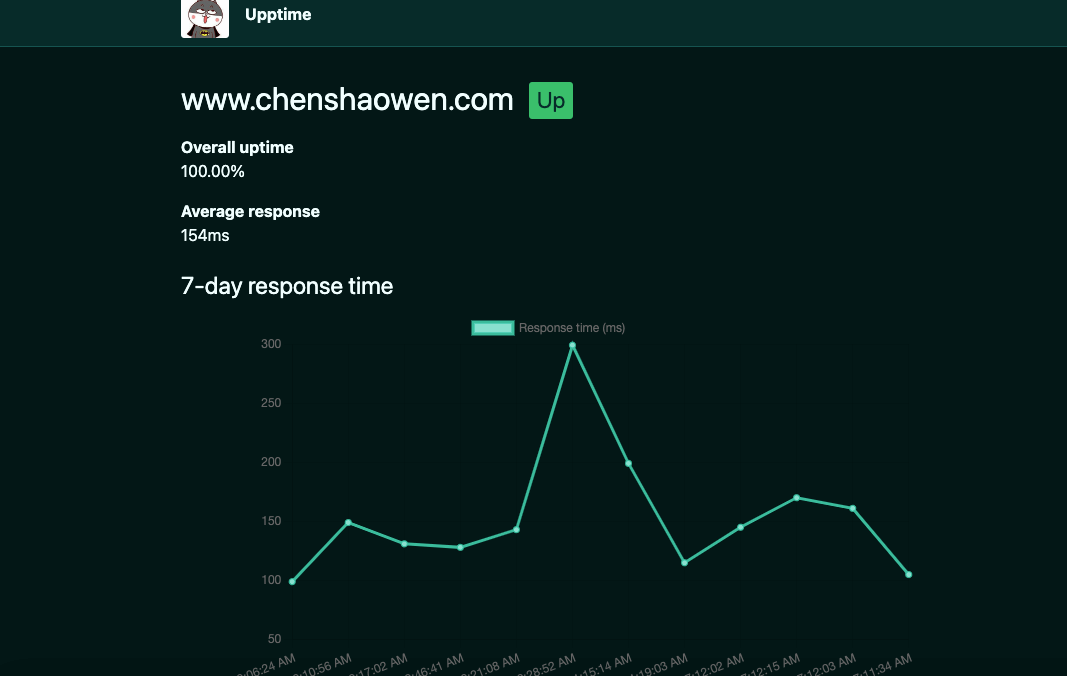
Click a monitored item to view its history, as shown below:
When an alert is triggered, an issue is created, as shown below:
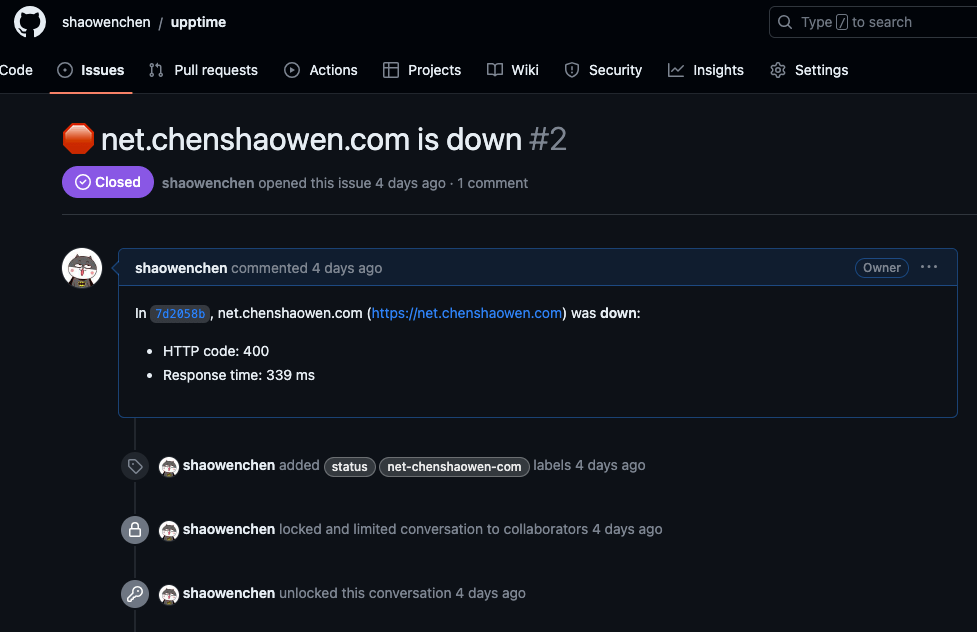
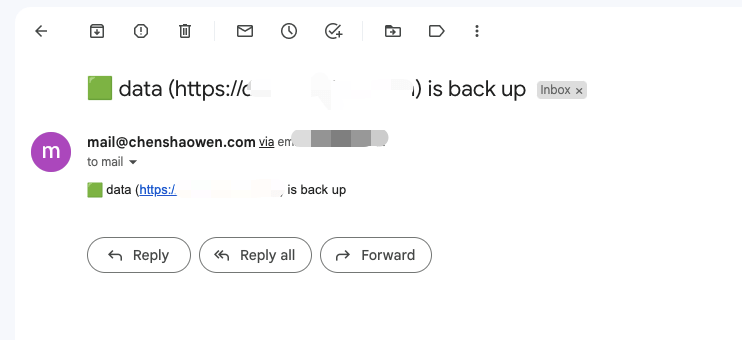
When the alert recovers, the issue is closed automatically. Of course, you also receive email notifications for the alert being triggered and recovering, as shown below:
5.2 Summary
This article mainly explained how to use Upptime to monitor a website’s availability, and how to configure alert notifications. Upptime’s configuration is very simple, and it offers many monitoring methods that can satisfy most monitoring needs.
But running the Upptime project on GitHub Actions may carry a risk of abuse. If you have your own server, connecting it to GitHub Actions as a self-hosted runner is a better choice. At the same time, a self-hosted runner serves as a custom monitoring point that can check from a location closer to users, giving better accuracy.
