The hard part of a monitoring system is storing large volumes of time-series data and providing high-performance query capability; the hard part of an alerting system is designing an efficient alert engine and implementing a flexible alert escalation mechanism. I have been tracking monitoring and alerting systems for a while now, and this post mainly organizes some of the concepts, components, and research options related to monitoring and alerting.
1. Components of a Monitoring and Alerting System
Everyone has their own understanding of what monitoring and alerting mean. Mine is: monitoring records what happened, for analysis before and after the fact; alerting is about being told in time when something unexpected happens.
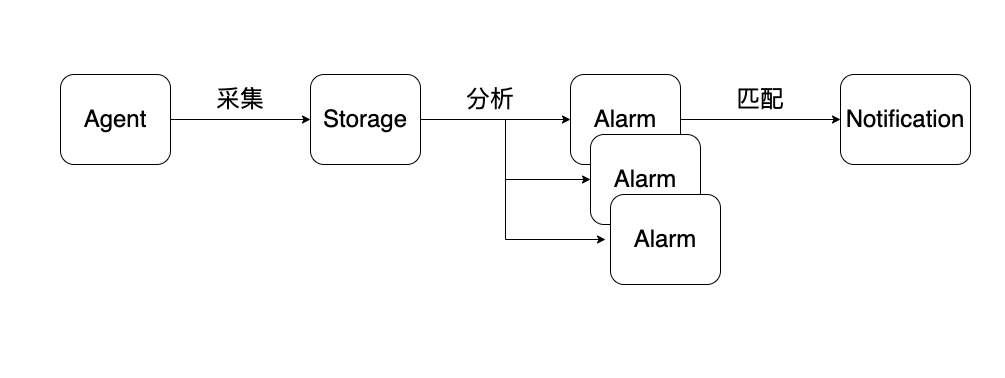
As the diagram above shows, a monitoring and alerting system consists of the following parts:
Agent - collects data and reports the metrics of interest
Storage - stores the data reported by the Agent
Alarm - checks whether the reported data reaches a preset threshold
Notification - sends the alert to the designated recipient
2. Collection
2.1 Data Format for Collection
Unlike traditional relational databases, monitoring metric data is essentially time-based sampling, which makes it a good fit for a time-series database. Most mainstream time-series databases describe a metric using a Metric plus Tags, where the tags record the metric’s dimensional information. Here is one piece of monitoring data:
api_http_requests_total{path="/home",status=200,method="GET",instance="10.10.12.11"}
Here the series name is api_http_requests_total, and the labels are path, status, method, and instance; the series name together with the labels determines a time series.
That is why we can count the distribution of status codes by the status tag, or the proportion of request methods by the method tag.
2.2 The Exporter Collection Component
An Exporter exposes metric data over an HTTP service for a scraper to pull, for example exposing it to Pormetheus. An Exporter does not store historical data; it only waits for the scraper to pull, at which point it serves the most recent data.
In the open-source community there are already Exporters for all kinds of hosts and middleware, which is very convenient.
2.3 The All-in-One Exporter - Telegraf
The annoying thing about using Exporters is that the host has one Exporter, MySQL has one Exporter, and if there are many operational components, the maintenance cost of all these Exporters is high.
Telegraf takes a Logstash-like Pipeline approach, assembling collection capability out of input, output, and processor plugins. So we only need a single Telegraf plus several configuration files to replace many different Exporters, greatly reducing the maintenance cost.
On the other hand, because Telegraf bundles so many collectors, its executable ends up very large. So we sometimes trim Telegraf, removing the parts we do not use, to keep the binary small enough.
2.4 Pushgateway Covers the Push Scenario
An Exporter only provides an HTTP endpoint and passively waits to be scraped. But in some scenarios the metric data needs to be pushed actively — for example a short-lived Job that is destroyed before the scraper ever pulls it. In that case Pushgateway can accept the monitoring data a Job pushes proactively, and then wait for the scraper to pull it.
Another scenario is that if every Exporter is configured as a scrape endpoint on the scraper side, that configuration becomes hard to maintain. So you can also use Pushgateway to aggregate the data ahead of time and then serve it to the scraper. This reduces the cost of maintaining scrape endpoints on the scraper side.
Yet another scenario is when the network between the Exporter and the scraper is unreliable and the traffic needs to be relayed through Pushgateway.
3. Storage
3.1 Characteristics of Time-Series Databases
Monitoring data is strongly tied to time series, so a time-series database is what you need. Plenty of open-source products are already available for this — InfluxDB, OpenTSDB, M3DB, and so on — and the core problem these time-series databases run into is vertical write, horizontal read.
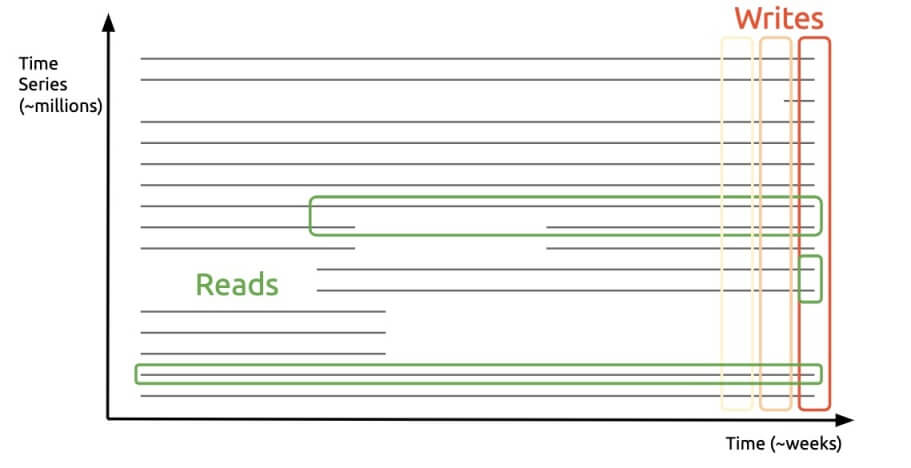
As the diagram above shows, when collecting metrics we collect the data of a single instant each time, yet when querying we aggregate by a particular Metric and filter by Tag. This way of working poses a challenge to the design and implementation of a time-series database: it must be able to store large amounts of vertical metric data quickly, and also query horizontal data quickly.
3.2 Prometheus
Prometheus is a monitoring and alerting project open-sourced at Soundcloud by former Google engineers. Today most companies use Pormetheus as their monitoring and alerting tool.
Prometheus’s distinguishing feature is that it has both data storage and an alert engine. So deploying a single Pormetheus gives you something that works out of the box and covers most monitoring scenarios.
The problem with Prometheus is that the service is a single point and rules are configured in files. When the single Prometheus restarts, or when scraping Exporter data fails, monitoring data goes missing. So in production, some teams run two Prometheus instances scraping Exporter metrics at the same time.
3.3 Why Remote Storage
To reduce its own complexity, Prometheus uses local storage, which is enough for most user-scale monitoring scenarios but cannot satisfy the need to query long-term data. So when the business is large, we treat Prometheus’s local data as temporary data and move the long-term data to a remote store.
In the end, alert queries over recent data use Prometheus, while statistical queries over historical data use remote storage. Here are three remote storage options:
- InfluxDB
InfluxDB has long held first place in the time-series database rankings. InfluxDB’s cluster mode is paid, while the single-instance mode is open source. We can remote write from Prometheus to InfluxDB: when Grafana performs a long-term query, it uses InfluxQL to query InfluxDB, and for a short-term query it uses PromQL to query Prometheus.
- VictoriaMetrics
VictoriaMetrics also comes in single-node and cluster versions. VictoriaMetrics is not 100% compatible with PromQL query statements. If you do not use alerting, the single-node VictoriaMetrics can directly replace Prometheus, and it can also be used as Prometheus’s remote storage. VictoriaMetrics also offers a cluster mode containing the vmagent, vmstorage, vminsert, vmselect, and vmalert components, providing a complete high-availability, storage-scalable monitoring and alerting solution.
- Thanos
Thanos positions itself as the monitoring terminator and is strongly recommended by the community. Thanos consists of the Querier, Slidercar, Store, and Compactor components, mounting a Sidecar on Prometheus to report data and provide query capability. Thanos stores monitoring data in S3, and the Compator also samples the data. The benefit is that when querying long-term data, it can first query the sampled data in S3 to display a result, rather than reading the full dataset.
4. Analysis
Once metrics are reported and the data has entered the time-series database, we need to keep querying and analyzing whether the metrics match expectations, or to look at long-term data.
Data checking is essentially a process of repeatedly calling an interface to query. Implemented in code, it is a loop. But there are many details to consider along the way:
- nodata
The absence of data may be because the service did not report any data, because the reporting path is broken, or because the query itself failed. How do we handle this? There are two common approaches: 1) report a special value for nodata; 2) implement nodata detection separately.
- Large-Volume Checking
When the number of configured per-minute detection rules reaches a certain order of magnitude, a single time-series database cannot keep up. This gives rise to a few optimization options, such as using a cluster to share the query load, or BIASing the detection time by a few seconds to spread the peak. Another option is to use a high-performance database such as Redis to temporarily store short-term metric data for alert detection.
5. Alerting
The analysis stage produces a large number of alert events, and pushing these straight to users would generate a lot of junk information. The purpose of the alerting module is to raise the value density of notifications, so that users can learn about production incidents accurately and efficiently.
- Managing Alert Rules
Alert rules provide the query statements the analysis stage needs. How to manage these alert rules efficiently is one of the problems an alerting system needs to solve.
- Managing Alert Instances
When monitoring data reaches an alert rule’s threshold, an alert instance is created. We need to manage alert instances. The state of an alert instance changes over time: firing, resolved, unhandled.
- Alertmanager
Many community solutions use the Prometheus + Alertmanager alerting combination, and when deploying Prometheus with helm you can also conveniently deploy the whole set. The alert engine that Prometheus provides pushes alerts to Alertmanager when it detects an anomaly. Alertmanager then sends the alert to the designated recipient according to its routing configuration. Altermanager also configures rules in files.
6. References
- https://toutiao.io/posts/lha0c8/preview
- https://www.163.com/dy/article/FCEQU6210511CUTF.html
- https://segmentfault.com/a/1190000040480428
- https://zyun.360.cn/blog/?p=1536
- https://github.com/prometheus/cloudwatch_exporter
- https://github.com/huaweicloud/cloudeye-exporter
- https://n9e.github.io/quickstart/standalone/
- http://mysql.taobao.org/monthly/2018/02/02/
- https://zhuanlan.zhihu.com/p/155719693
