1. Layering of Monitoring
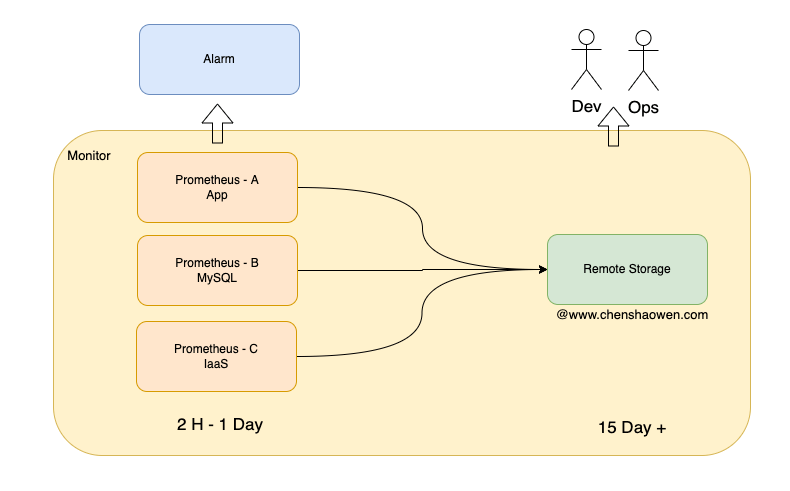
As shown above, when building a monitoring system, two strategies are used:
- Layered monitoring. The benefit of separating IaaS, MySQL middleware, and App layer monitoring is that the systems have high availability and fault tolerance between them. When App layer monitoring stops working, IaaS layer monitoring will immediately make that visible.
- Separation of long-term and short-term metrics. Short-term metrics are used to provide the alerting system with high-frequency queries over recent data, while long-term metrics are used to provide people with queries over data sets with a larger time span.
Here we refer to both collectively as a monitoring layering strategy, except that one layers along the infrastructure dimension and the other along the time dimension.
2. Current State and Selection
The current situation is: there is no long-term/short-term layering of monitoring, and a single Prometheus is shared. When querying long-period metrics, the memory and CPU usage of the server running Prometheus spikes, and it can even make the monitoring and alerting services unavailable.
The reasons are twofold:
- When querying long-period data, Prometheus loads a large amount of data into memory
- What Prometheus loads is not downsampled data
The larger the query range, the more memory is needed. In another production solution, we used the standalone version of VictoriaMetrics as remote storage, and the deployed memory was as high as 128 GB. At the same time, this approach also had data loss; it took a long time to troubleshoot before it was resolved with the parameter honor_timestamps: false.
The Prometheus Federation approach, on the other hand, only solves aggregating multiple Prometheis together and does not provide sampling capability, so it cannot speed up long-term metric queries and is not suitable for the current remote storage scenario.
Finally, seeing that the Thanos Compact component can compress and downsample metric data, we decided to try using Thanos as the remote storage for the current multiple Prometheis.
3. Several Deployment Modes of Thanos
3.1 Basic Components
- Query, implements the Prometheus API and exposes a query interface consistent with Prometheus
- Sidecar, used to connect to Prometheus, provides the Query query interface, and can also report data
- Store Gateway, accesses metric data stored in object storage
- Compact, compresses samples and cleans up data in object storage
- Receive, receives data from Prometheus Remote Write
- Ruler, configures and manages alerting rules
3.2 Receive Mode
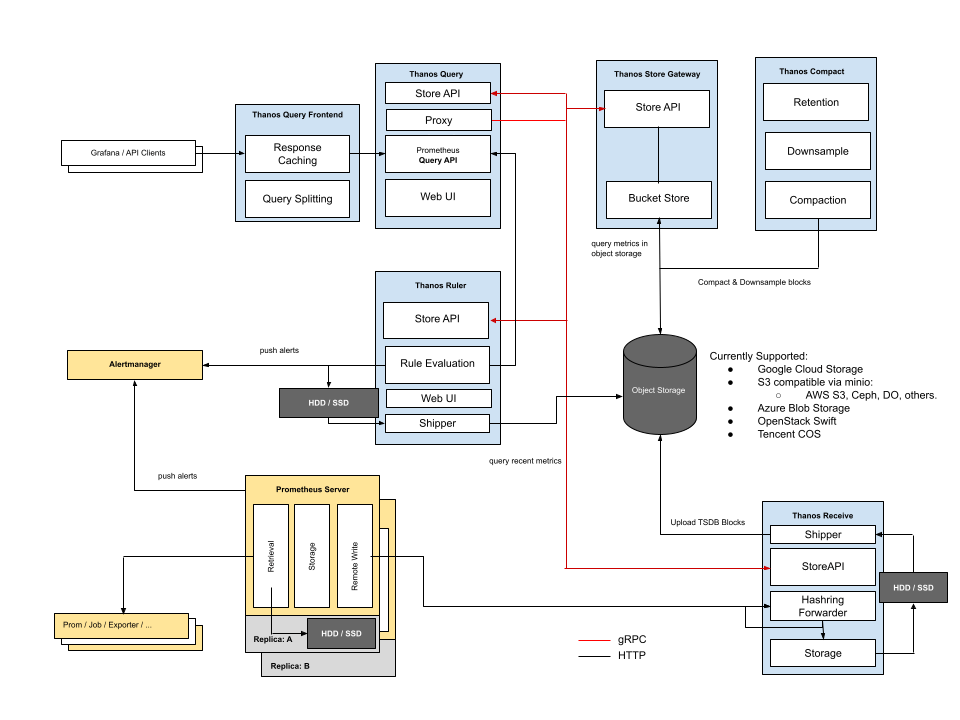
In Receive mode, you need to configure remote write in every Prometheus instance to upload data to Thanos. In this case, since all real-time data is stored in the Thanos Receiver, queries can be completed without the Sidecar component.
Advantages:
- Data is centralized
- Prometheus is stateless
- Only the Receiver needs to be exposed for Prometheus to access
Disadvantages:
- The Receiver bears remote write writes from a large number of Prometheis
3.3 Sidecar Mode
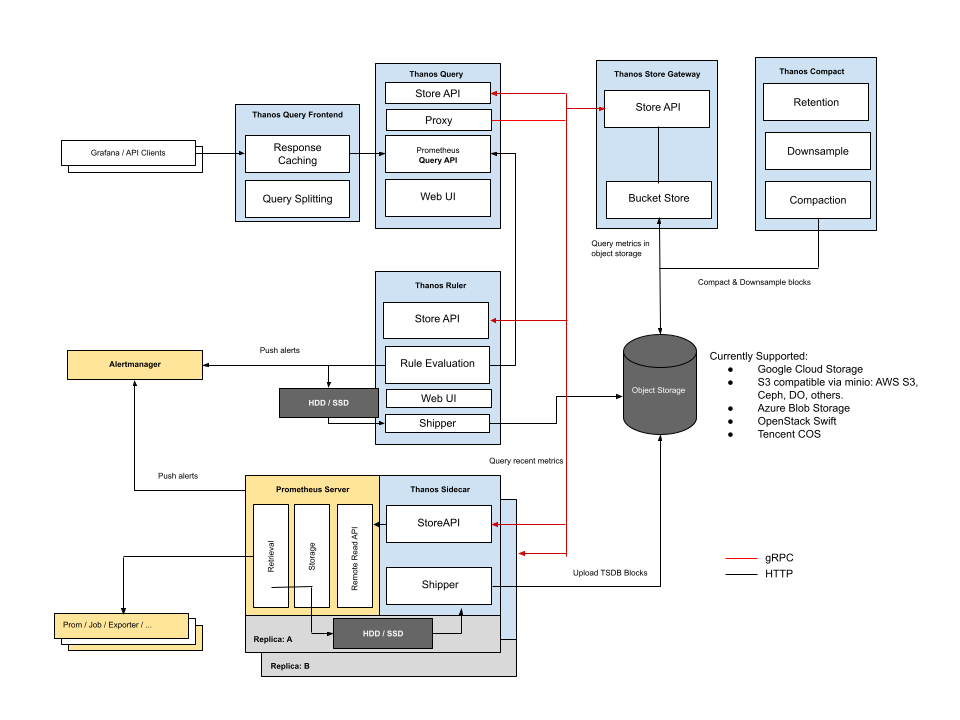
In Sidecar mode, a Thanos Sidecar component is added alongside every Prometheus instance to manage Prometheus. It mainly has two functions:
- Accepting query requests from the Query component. When Thanos queries short-term data, the request is forwarded to the Sidecar.
- Uploading Prometheus’s short-term metric data. By default, a block is created every two hours and uploaded to object storage.
Advantages:
- Easy to integrate, no need to modify the existing configuration
Disadvantages:
- Recent data requires a network request between Query and Sidecar, which adds extra latency
- The Store Gateway needs to be able to access every Prometheus instance
4. Deploying Thanos
4.1 Deploy a Minio
Please refer to the documentation: Build Artifacts and Cache in Jenkins
After the installation is complete, please test according to the configuration in the documentation to make sure the Minio service works properly.
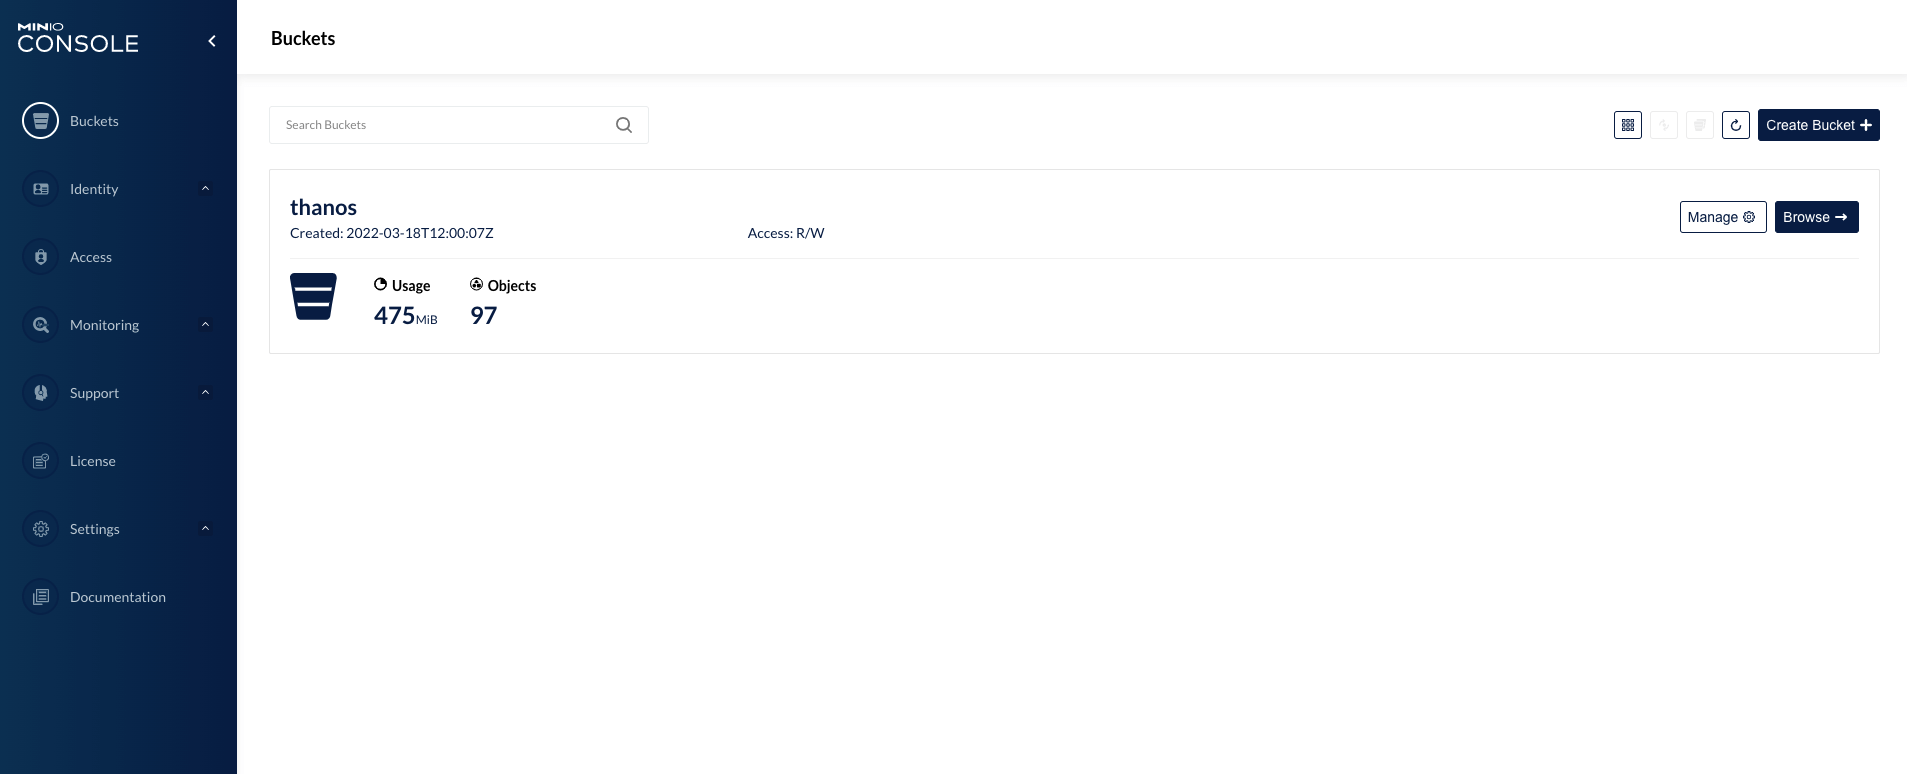
4.2 Create a Bucket Named thanos on Minio
As shown below:
4.3 Check That the Prometheus Version Meets Thanos’s Requirements
Currently Thanos requires the Prometheus version to preferably be no lower than v2.13.
4.4 Deploy Thanos
- Make sure a default storage class is available on the Kubernetes cluster
| |
- Create a namespace thanos
| |
- Deploy Thanos
| |
Modify the Minio access address in the demo/objectstorage.yaml file. Then create the Thanos workloads:
| |
- View the workloads
| |
Deploying Thanos consumes very few resources.
4.5 Access Thanos Query
- View the ports of the Thanos services
| |
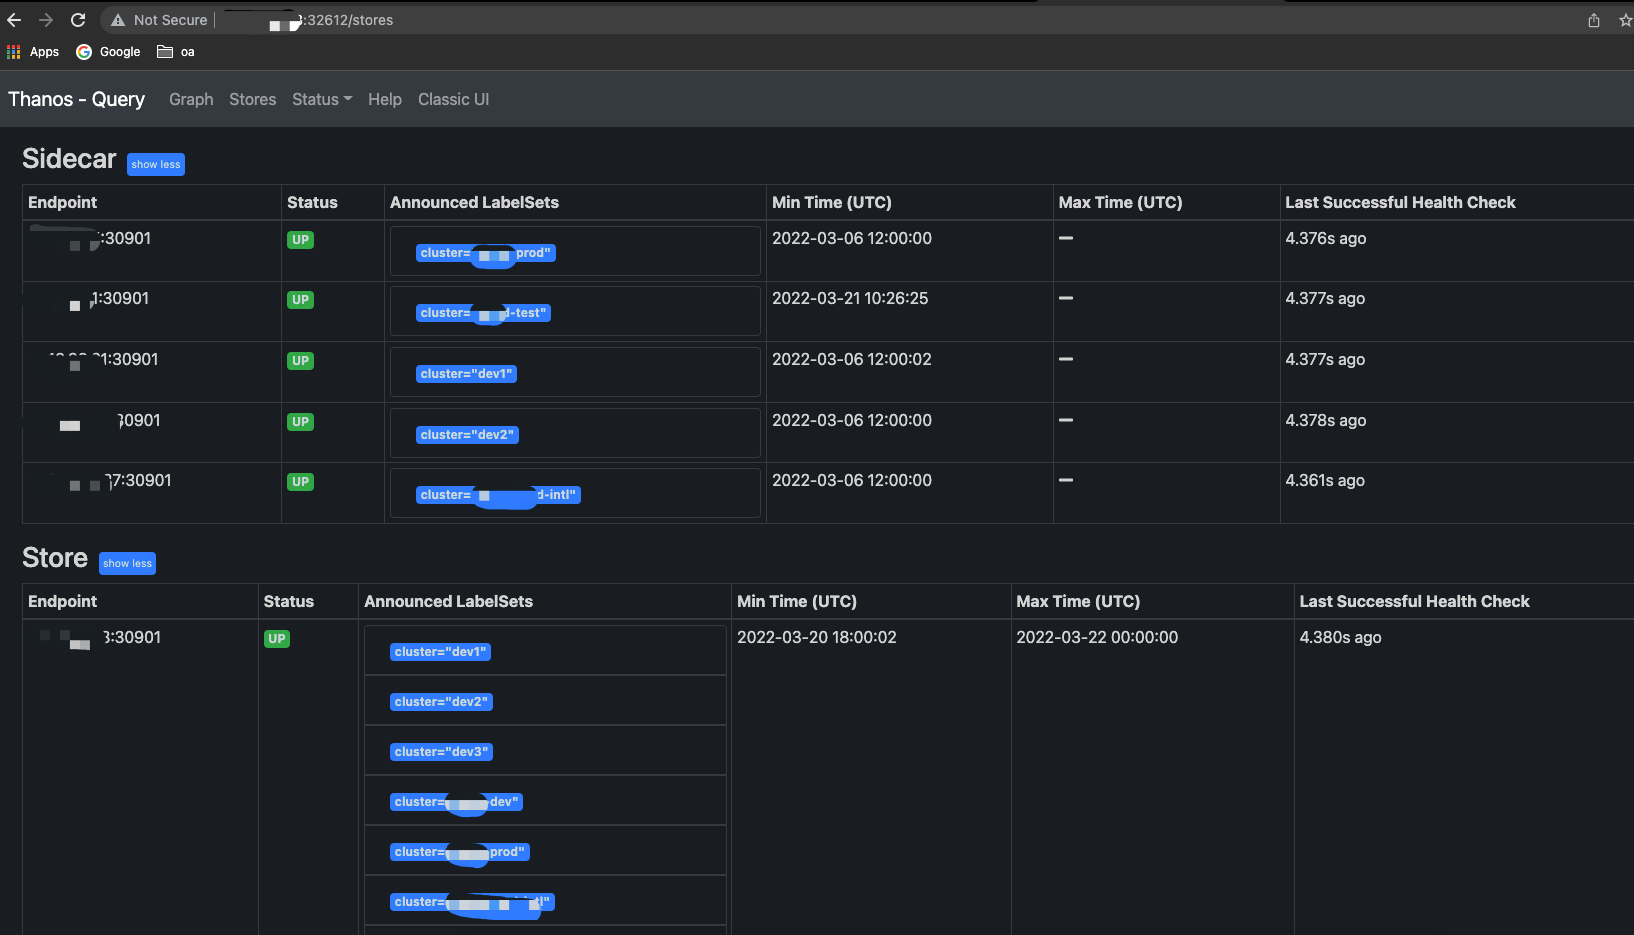
- Access the Thanos Query page
thanos-query provides an http access entry point on port 9090, so here we access the page provided by the Query component through host IP:32612.
5. Adding a Thanos Sidecar to Prometheus
Sidecar mode has lower configuration requirements for Thanos, whereas Receive mode needs to continuously accept Remote Write from many Prometheis, so here we choose Sidecar mode for cost reasons.
5.1 Add S3 Access Credentials in the Namespace Where Prometheus Resides
| |
Here the administrator account is used directly; in production, a separate account should be created for Thanos’s use of Minio.
5.2 Add an Extra Label to Prometheus to Mark the Instance
By adding external_labels in Prometheus, you can globally add an extra label to each Prometheus instance to uniquely mark an instance.
- Edit the configuration file
| |
- Add the following content
| |
Here a label named cluster=dev has been added. All metrics reported by this Prometheus instance will carry this label, which makes query filtering convenient.
5.3 Modify the Prometheus Startup Parameters to Disable Compaction
- Edit the Prometheus deployment file
Some use a Deployment and some use a StatefulSet, but in all cases the Prometheus startup parameters must be modified
| |
- Make the maximum and minimum values of the tsdb storage block equal
| |
Only when storage.tsdb.min-block-duration and storage.tsdb.max-block-duration are equal can you ensure that Prometheus has disabled local compaction, avoiding a failed Thanos upload during compaction.
5.4 Add a Thanos Sidecar to Prometheus
- Edit the Prometheus deployment file
| |
- Add the following container
| |
- Add the secret mount
| |
- Restart Prometheus
A rolling upgrade will encounter the following error, caused by the previous Prometheus Pod not having released the file directory.
| |
Therefore you need to first set the replica count to 0, then set it to 1, to restart Prometheus.
| |
5.5 Add a Grpc Remote Access Port to the Prometheus Sidecar
- Edit the Prometheus Service configuration
| |
- Add a Service port to expose the Grpc service to the Thanos Store Gateway
| |
5.6 Add the Store Grpc Address in Thanos Query
Finally, you also need to add the Grpc address of the Prometheus Sidecar above in the Thanos Store Gateway.
- Edit Thanos Query
| |
- Add
--store=0.0.0.0:30901to the startup parameters
| |
Here 0.0.0.0:30901 needs to be replaced with the Grpc access entry point exposed by the Prometheus Sidecar above. In this way, when Thanos Query provides query capability, short-term data will be queried via Grpc instead of querying the data in object storage.
At this point, on the Thanos Query page mentioned above you can already see the newly added 0.0.0.0:30901 Endpoint record, and its status should be Up.
5.7 View the Synced Data in Minio
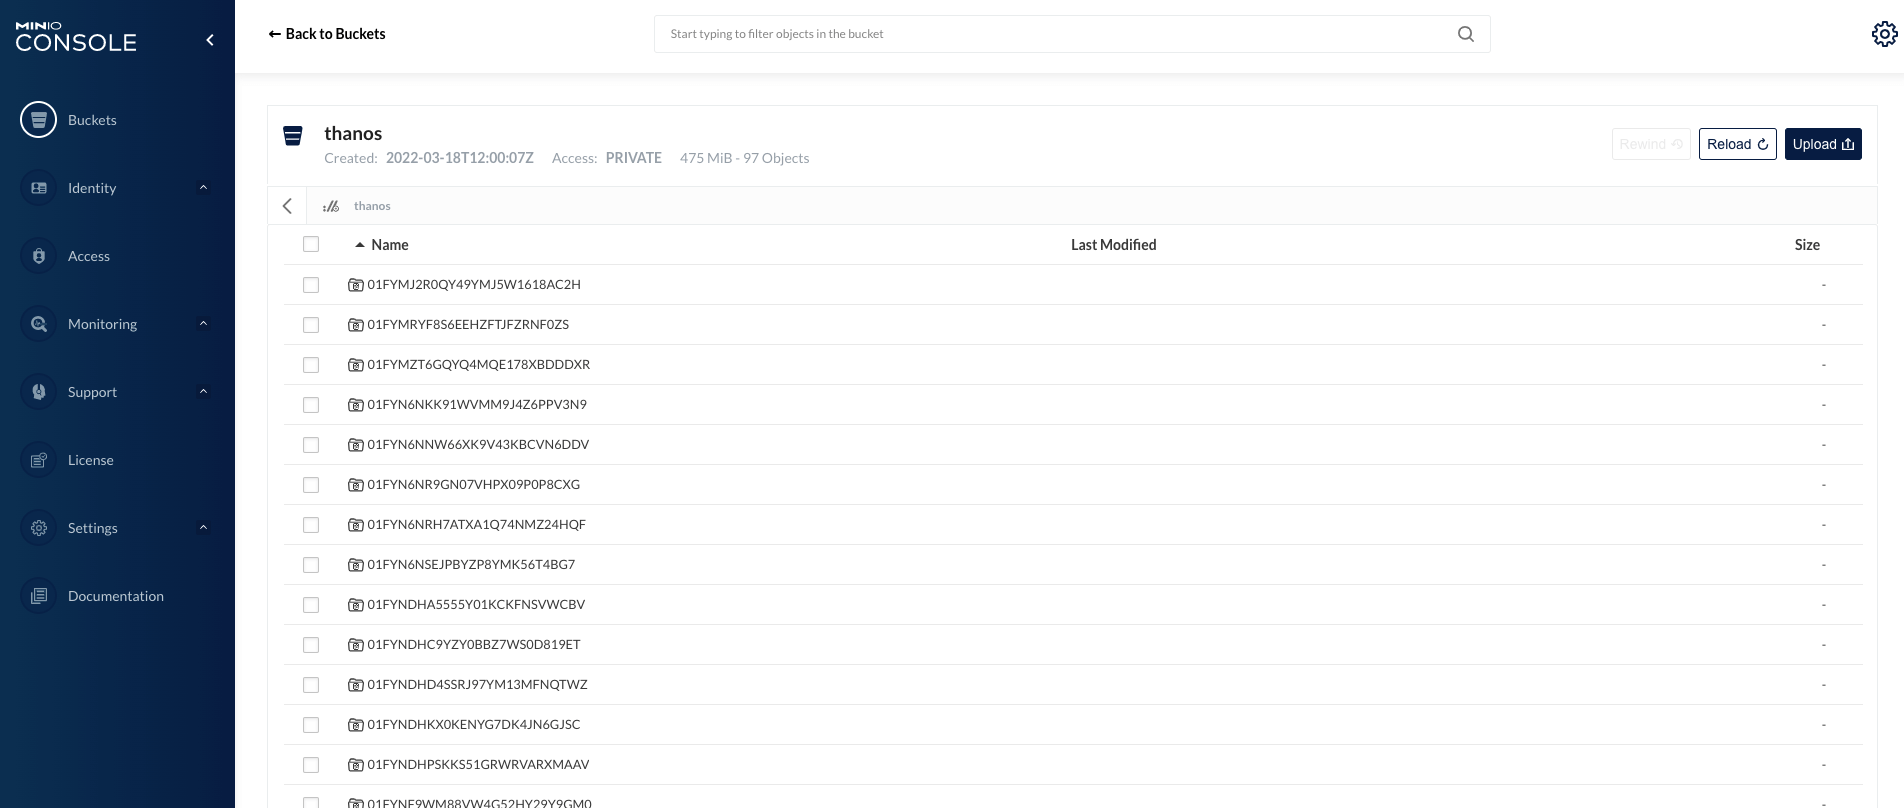
A total of 6 clusters were added, with roughly 40 Pods per cluster, and half a day used about 2.1 GB of storage and 303 objects.
6. Grafana Configuration
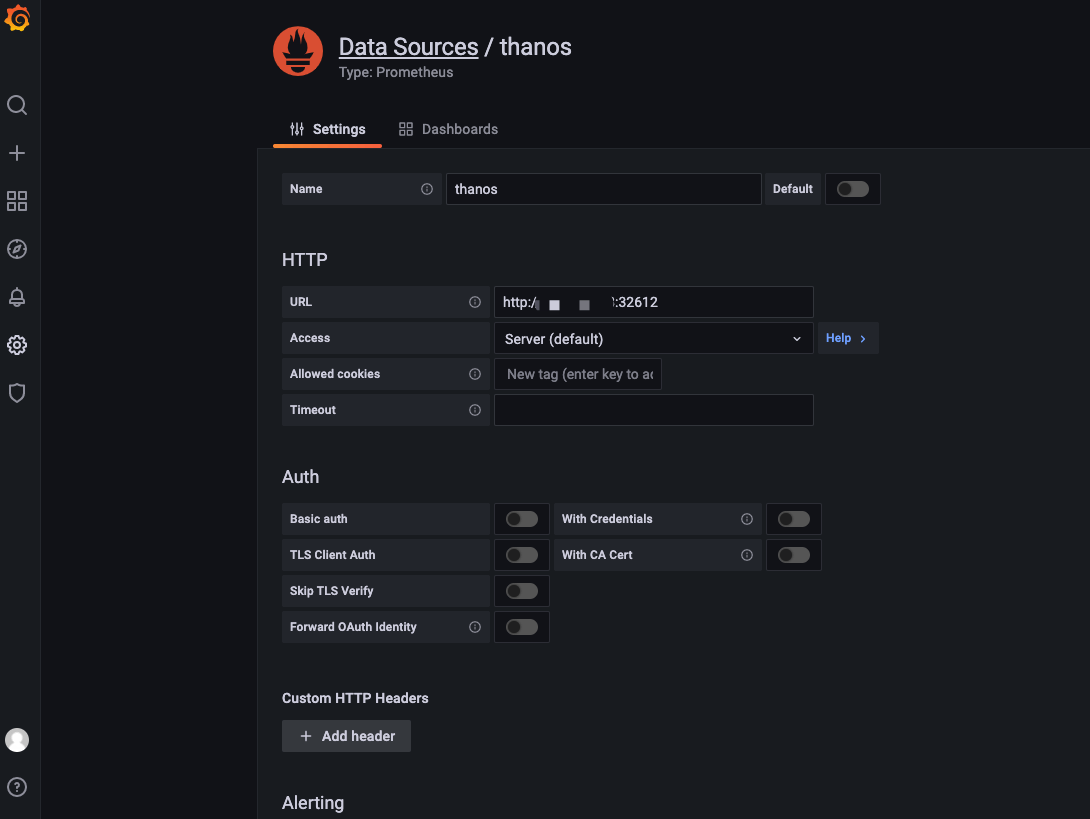
6.1 Add a Data Source
Adding a Thanos Query data source in Grafana works the same way as adding Prometheus. As shown below:
6.2 Modify Grafana Panels to Adapt to cluster Label Filtering
Here the panels viewed on a per-Kubernetes-cluster basis are slightly modified.
- Add a cluster filtering variable
Above, I added a global external_labels to every Prometheus, using the cluster field to distinguish different clusters.
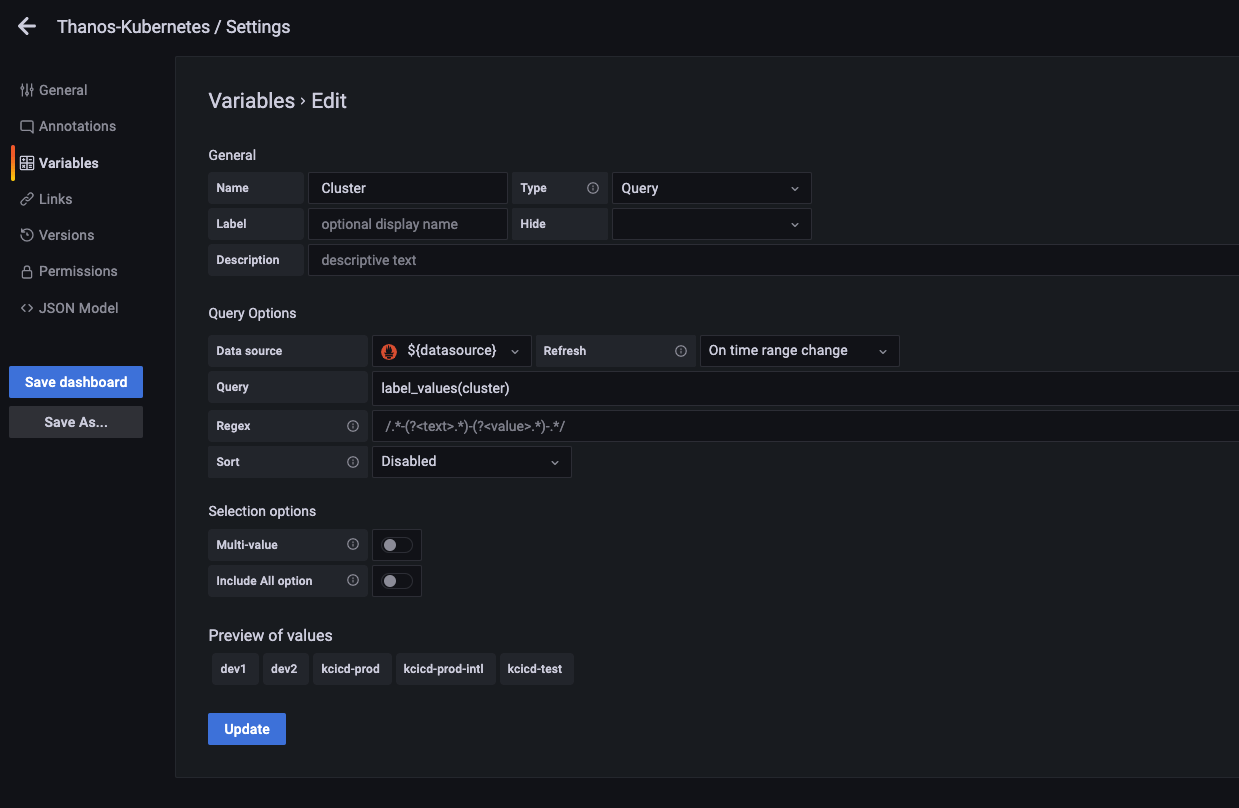
As shown above, add a Cluster variable in the panel, using the cluster label from the metrics for filtering.
- Edit the filter query condition of every view
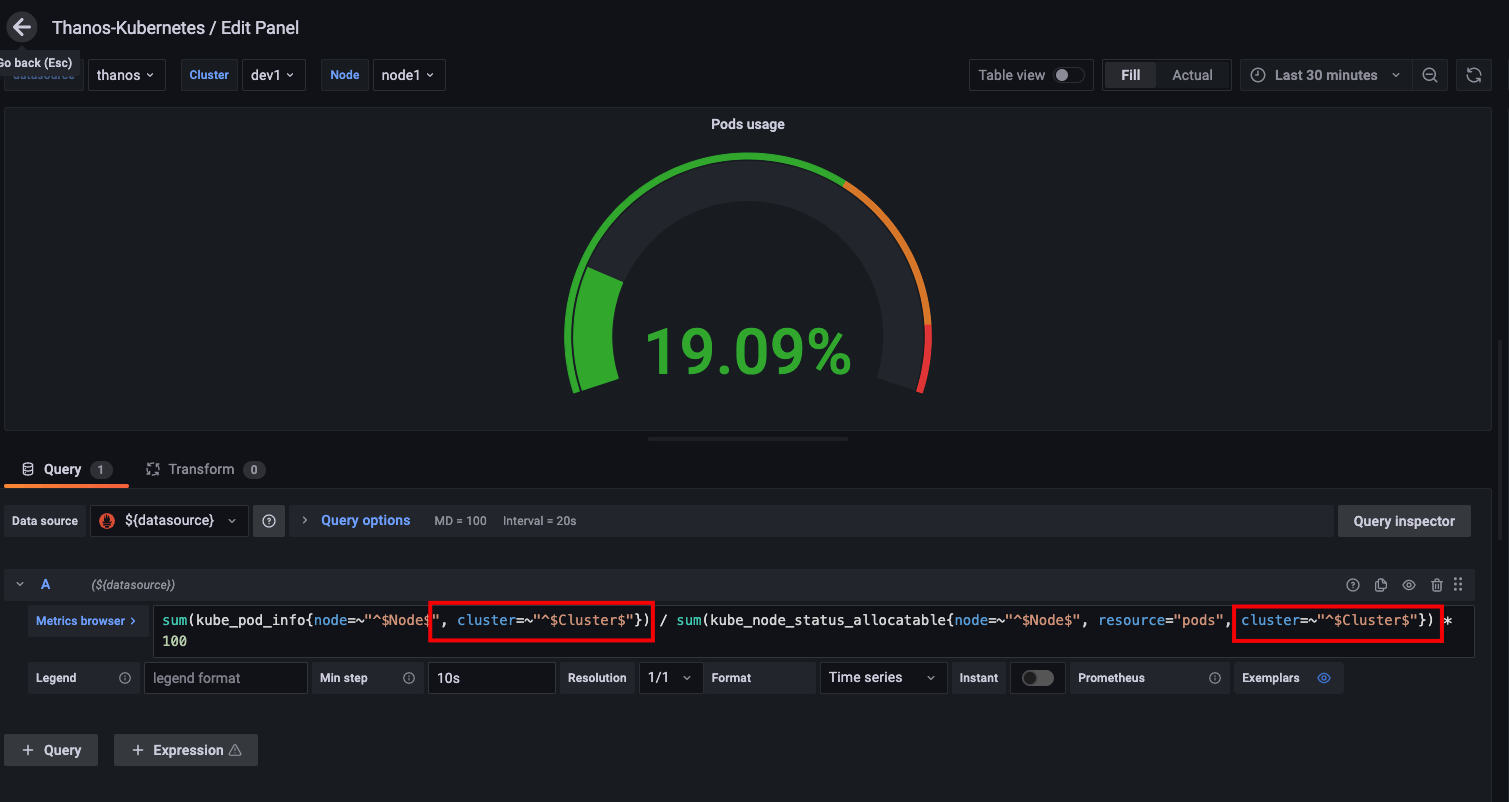
As shown above, you need to add an extra filter condition to the expression of every view, cluster=~"^$Cluster$"}. Of course, you can also export the panels, modify them in bulk in an editor, and then import them back into Grafana.
6.3 View the Thanos and Prometheus Data Sources
- Using the Thanos data source
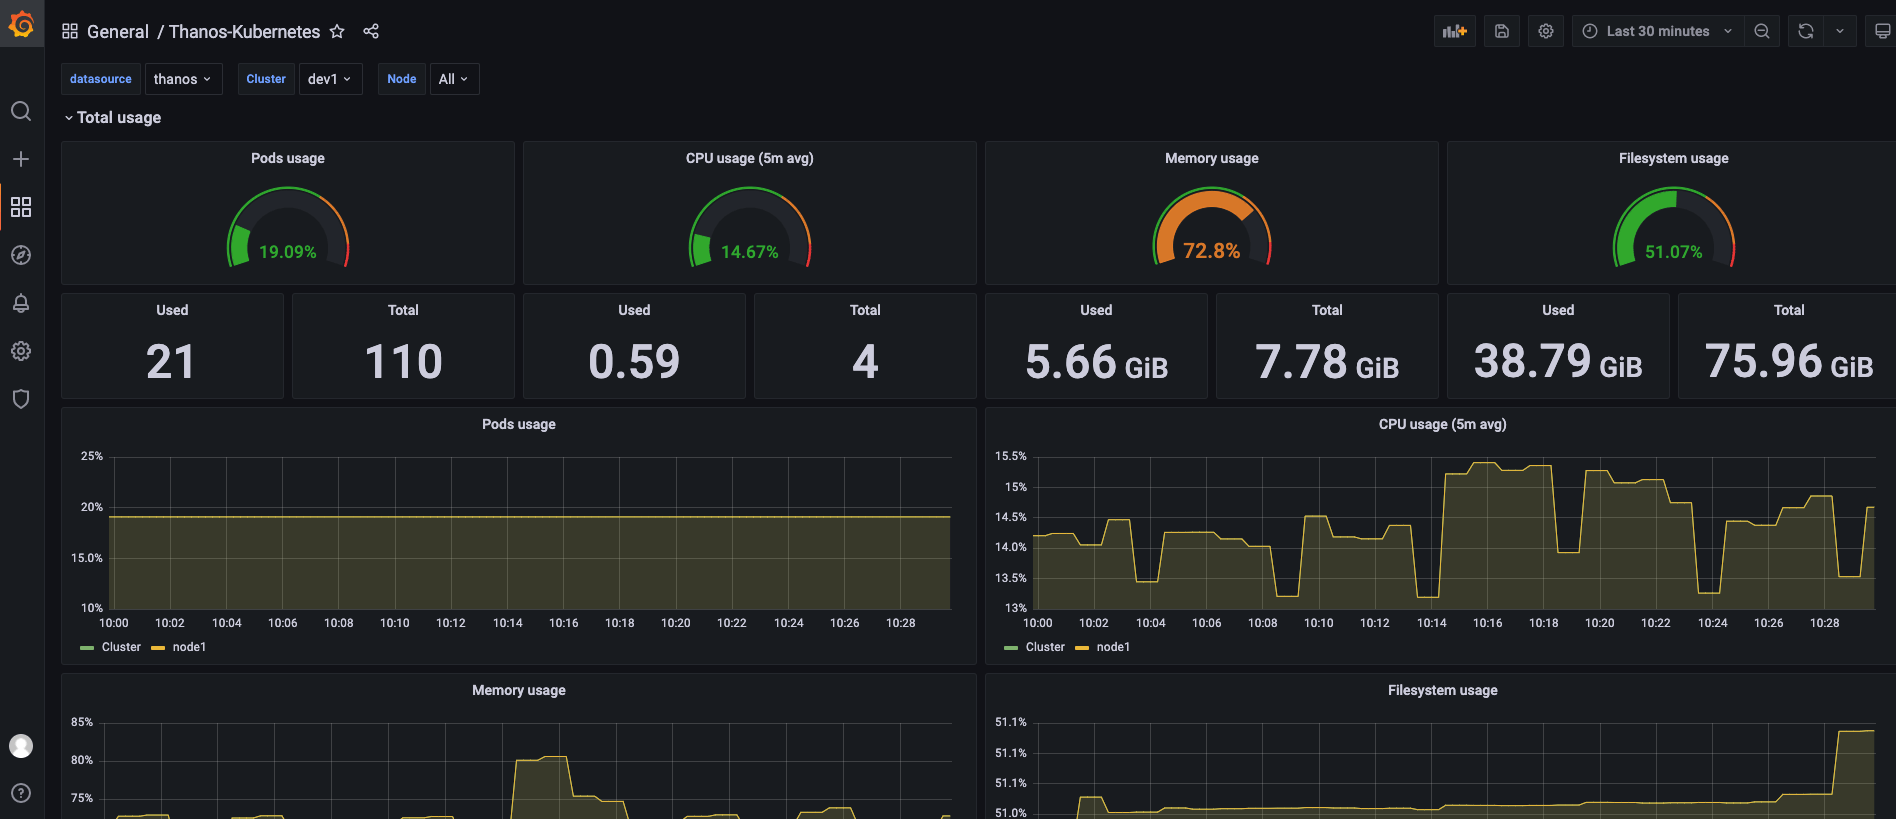
- Using the Prometheus data source
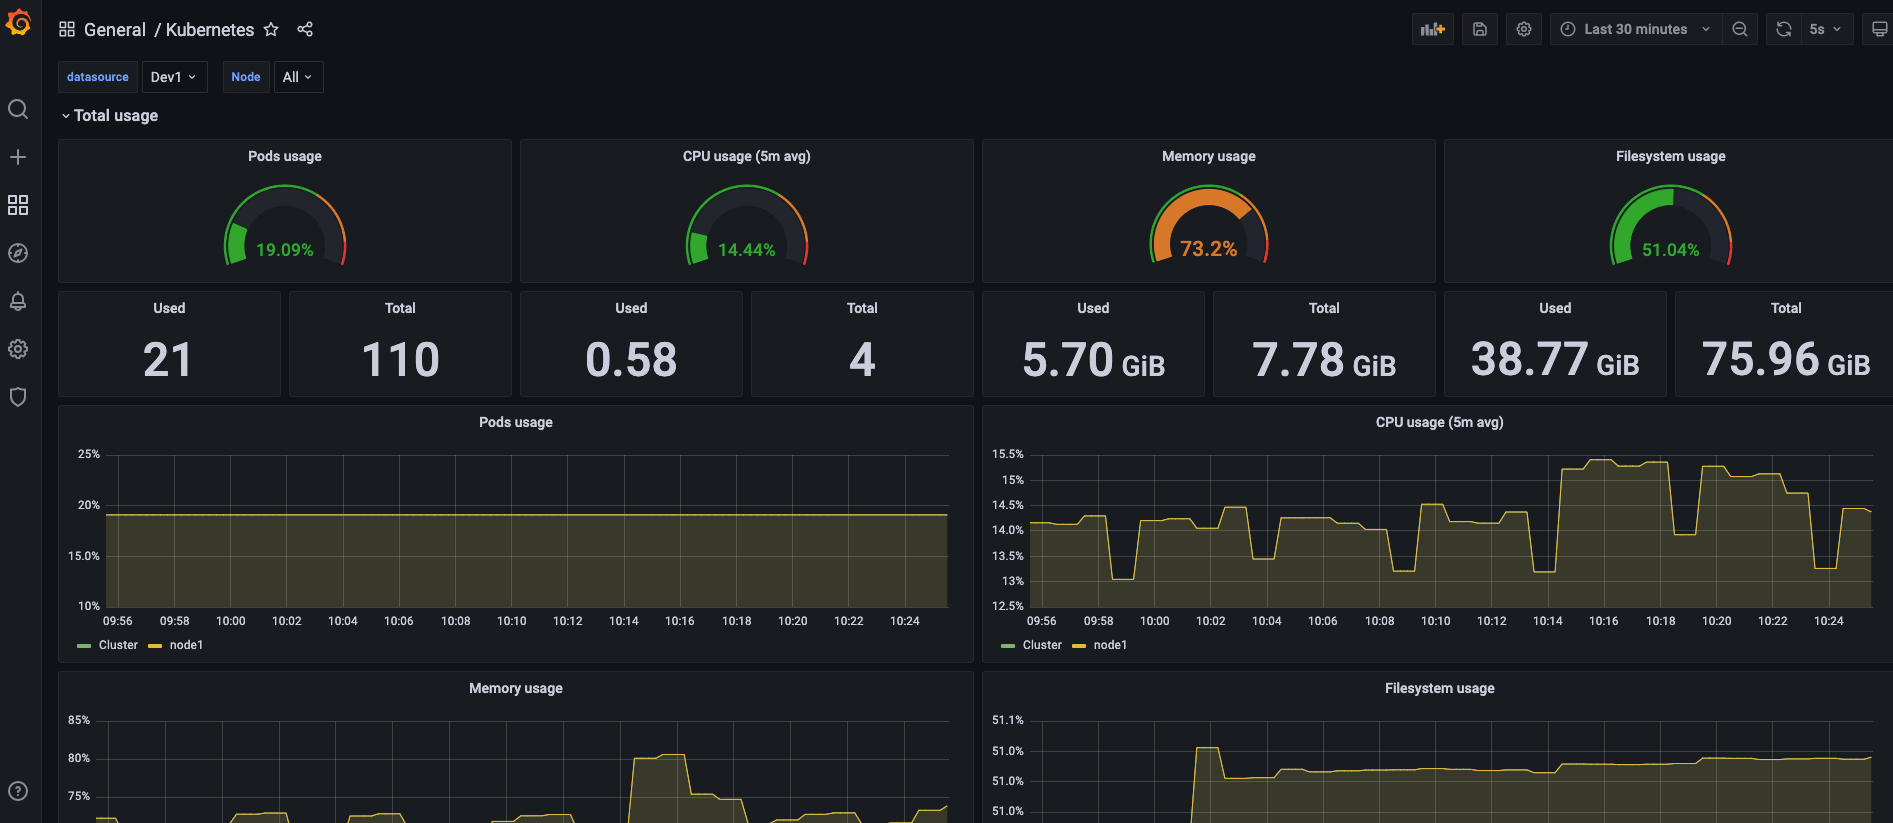
Comparing the data of the two panels, you can see that the metrics they display are identical. Therefore, we can use a single Thanos data source to replace the scenario of managing multiple Prometheus data sources in a scattered way.
Here the time scale of the data has not reached the parameter settings of the Thanos Compact component, so the downsampling effect is not shown.
7. Summary
This article mainly discusses some ideas about managing the monitoring data layer.
First, data should be layered: short-term data is stored directly in the nearby Prometheus, and long-term data is stored in Thanos object storage. Short-term data serves the high-frequency queries of the alerting system, and long-term data serves people for analysis.
The main reason for choosing Thanos is its downsampling. The Thanos compact component provides 5-minute and 1-hour downsampling; calculated at Prometheus’s 15s sampling frequency, the compression will reach 20x and 240x, which can greatly relieve the pressure of long-period queries. When using Sidecar mode, short-term data is queried via a Grpc call to the Prometheus API.
Finally, of course, the 6 clusters used locally were all connected to Thanos. Only after trying it yourself will you truly appreciate some of the details and handling logic involved. Although I have read quite a few architecture diagrams, documents, and blogs, none of them compares to trying it once yourself.
