1. What Falco Is
Falco is a cloud-native runtime security project contributed to the CNCF by Sysdig.
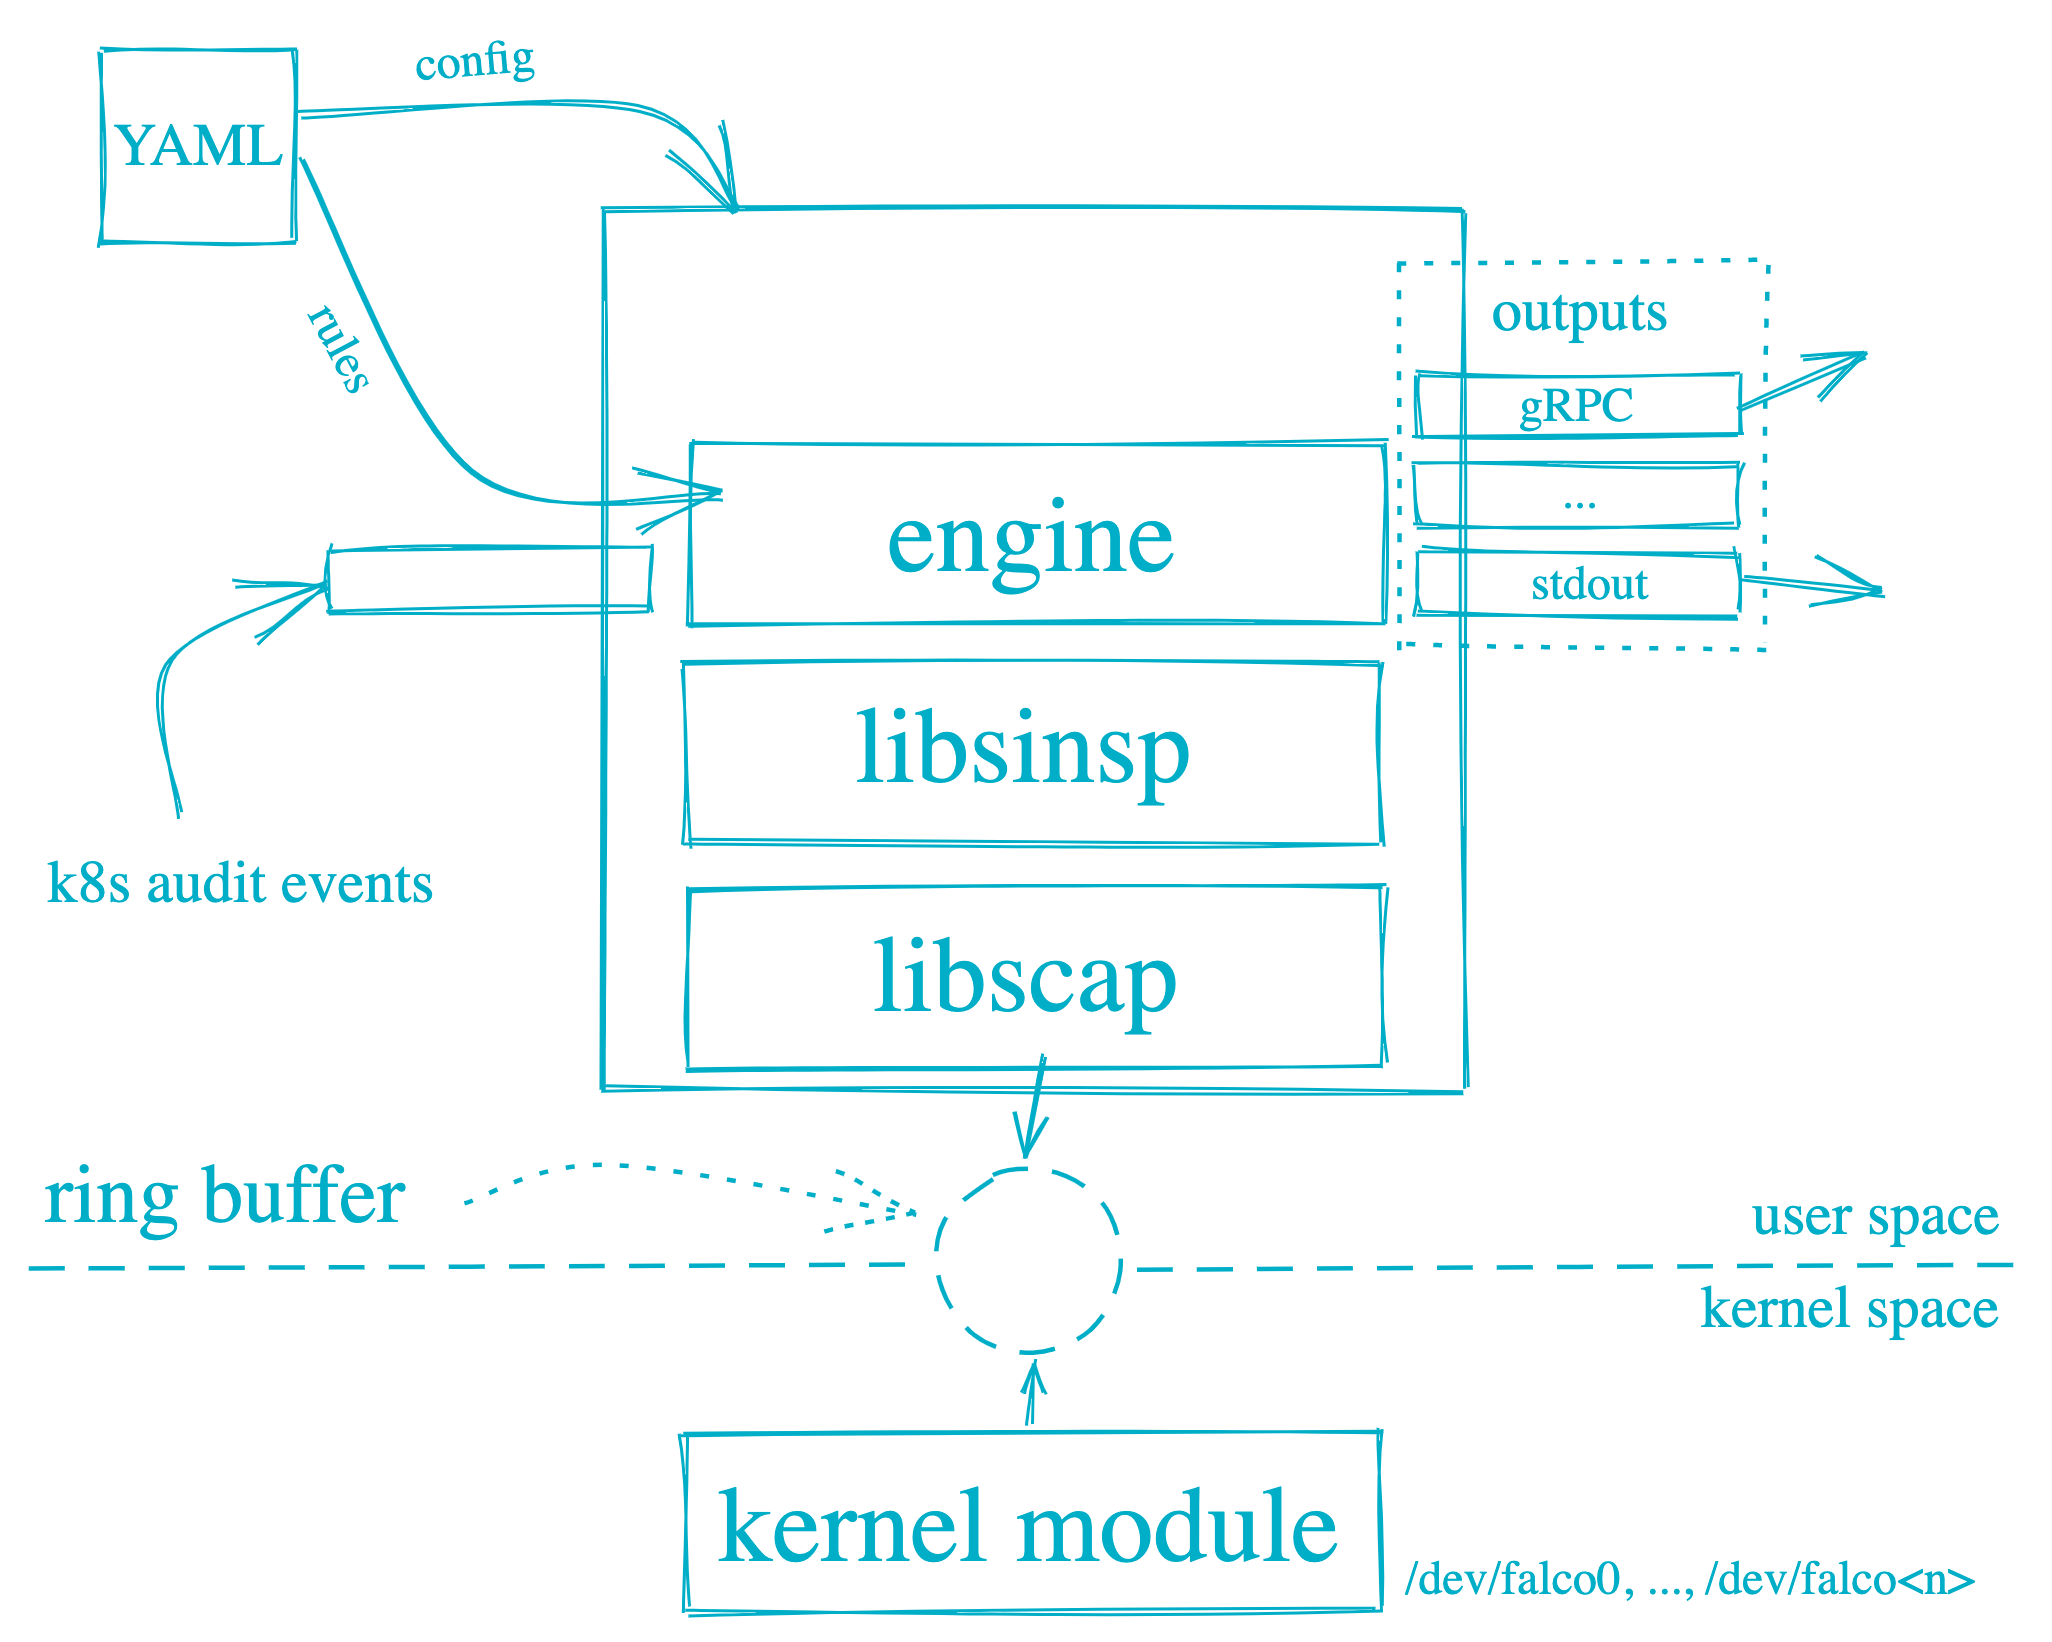
Falco implements an extensible event rule filtering engine. Through a series of operations — capturing events, matching security rules, and producing alert notifications — it can surface security problems in a system. The events come from system calls, and it also supports an ebpf probe; the rules are open source [1] and you can define your own extensions [2]. The architecture diagram is below:
Typical events Falco can detect include:
- A shell running inside a container
- A container running in privileged mode
- Reading sensitive data, such as
/etc/shadow - A container mounting a sensitive host path
- Outbound network connections
2. Generating Certificates
Falco’s gRPC requires mutual TLS authentication [3]. The Falco exporter exposes the relevant events over gRPC, and a system you build yourself can also integrate directly with Falco over gRPC. The steps below generate the certificates needed for the interaction; Falco’s official documentation is a bit dated and some of the operations will fail.
- Create the certificate directory
| |
- Create the CA certificate
| |
- Create the server certificate
| |
- Create the client certificate
| |
- List all the generated certificates
| |
3. Installing Falco on Kubernetes
- Add the Helm repository
| |
- Install falco [4]
| |
- Install falco-exporter
| |
- Check the services
During startup it requests ghcr.io to download the default rules, falco_rules.yaml.tar.gz. In a network-restricted environment, this download may fail.
| |
- [Optional] Uninstalling Falco
| |
4. Viewing Falco Event Data with a Grafana Dashboard
Looking at the falco-exporter svc, you can see that it has already exposed its metrics to Prometheus.
| |
Next, all you need to do is add a Grafana dashboard. Import 11914, which is https://grafana.com/grafana/dashboards/11914-falco-dashboard/. The data looks like the figure below:
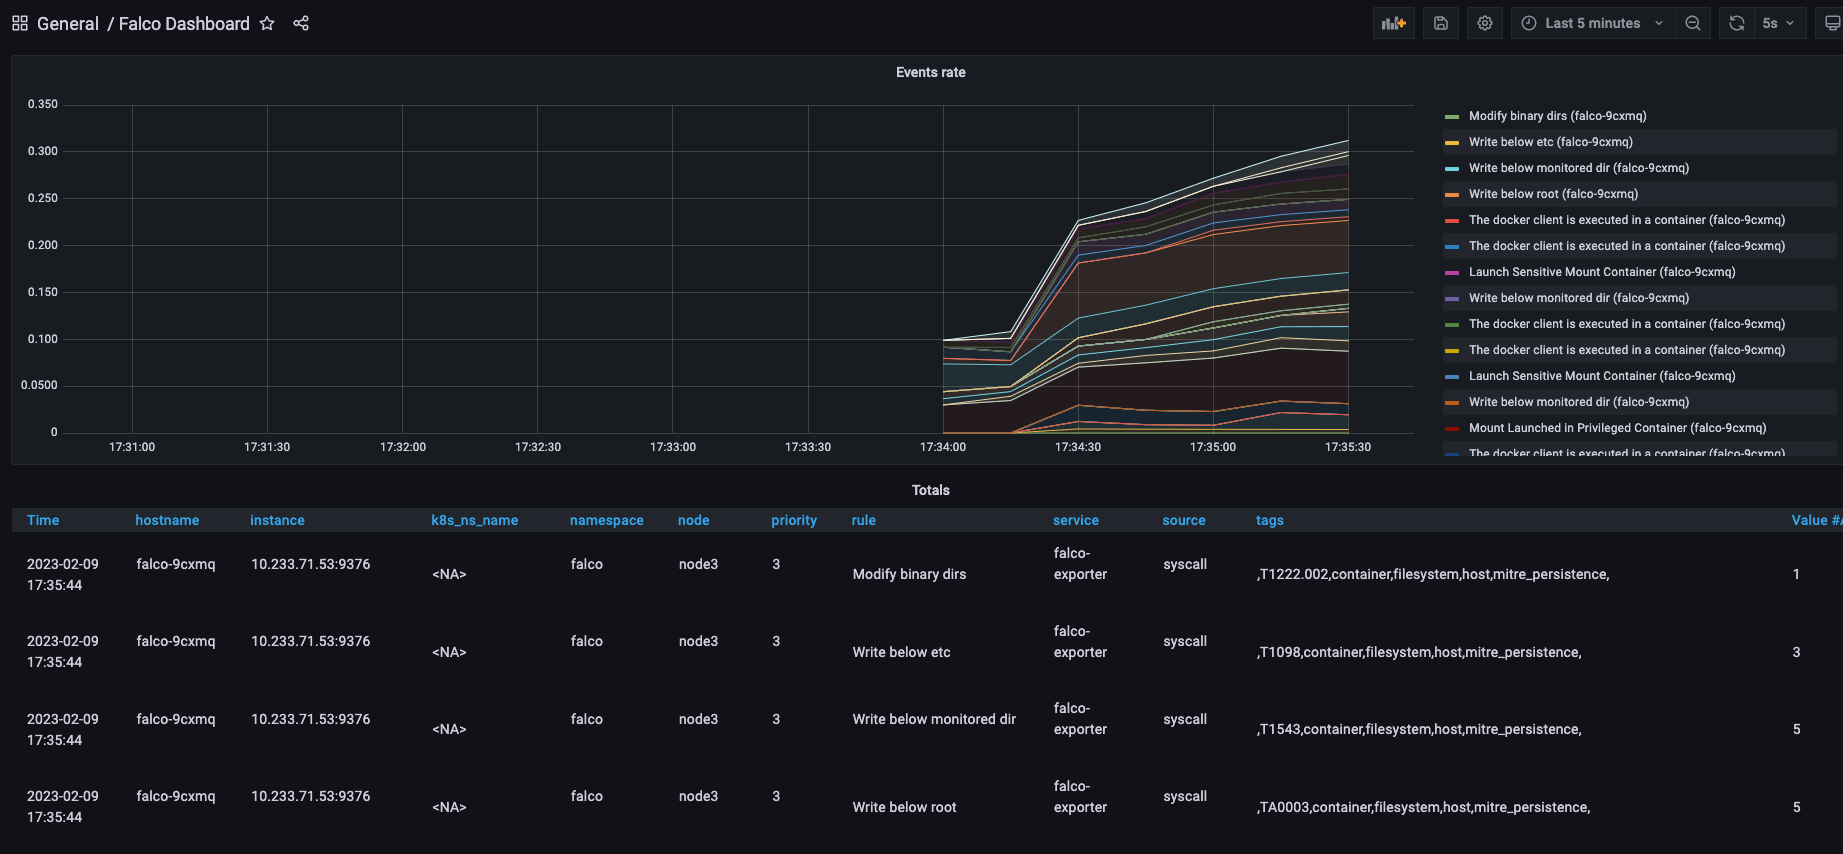
But the information exposed in the metrics is fairly limited. Querying falco_events{rule="Read sensitive file untrusted"} in Prometheus gives the result falco_events{app_kubernetes_io_instance="falco-exporter", app_kubernetes_io_managed_by="Helm", app_kubernetes_io_name="falco-exporter", app_kubernetes_io_version="0.8.0", helm_sh_chart="falco-exporter-0.9.1", hostname="falco-h57xg", instance="1.1.1.1:9376", job="kubernetes-service-endpoints", k8s_ns_name="<NA>", k8s_pod_name="<NA>", namespace="falco", node="node1", priority="4", rule="Read sensitive file untrusted", service="falco-exporter", source="syscall", tags=",T1020,T1083,T1212,T1552,T1555,container,filesystem,host,mitre_credential_access,mitre_discovery,"} , and it does not show details such as the executing user or the command that ran — you can only see limited information such as the event’s priority and the rule that triggered.
5. Viewing Events with falcosidekick-ui
falcosidekick mainly provides centralized event management and rich alerting channel capabilities, able to send alerts to slack, rocketchat, elasticsearch, and others [5].
falco-falcosidekick-ui, in turn, provides the ability to view falco events.
- Install falco-falcosidekick-ui
When installing falco just now, the following parameters were already added, so falcosidekick and falcosidekick-ui are already installed.
| |
- Expose the service port
| |
- Log in to the page and view the UI
Through the host IP at port 32000, you can open the falcosidekick ui page. The default account is admin and the default password is admin.
On the host, after reading a sensitive file with cat /etc/shadow, you can see the related event on the falcosidekick ui page, as shown below:
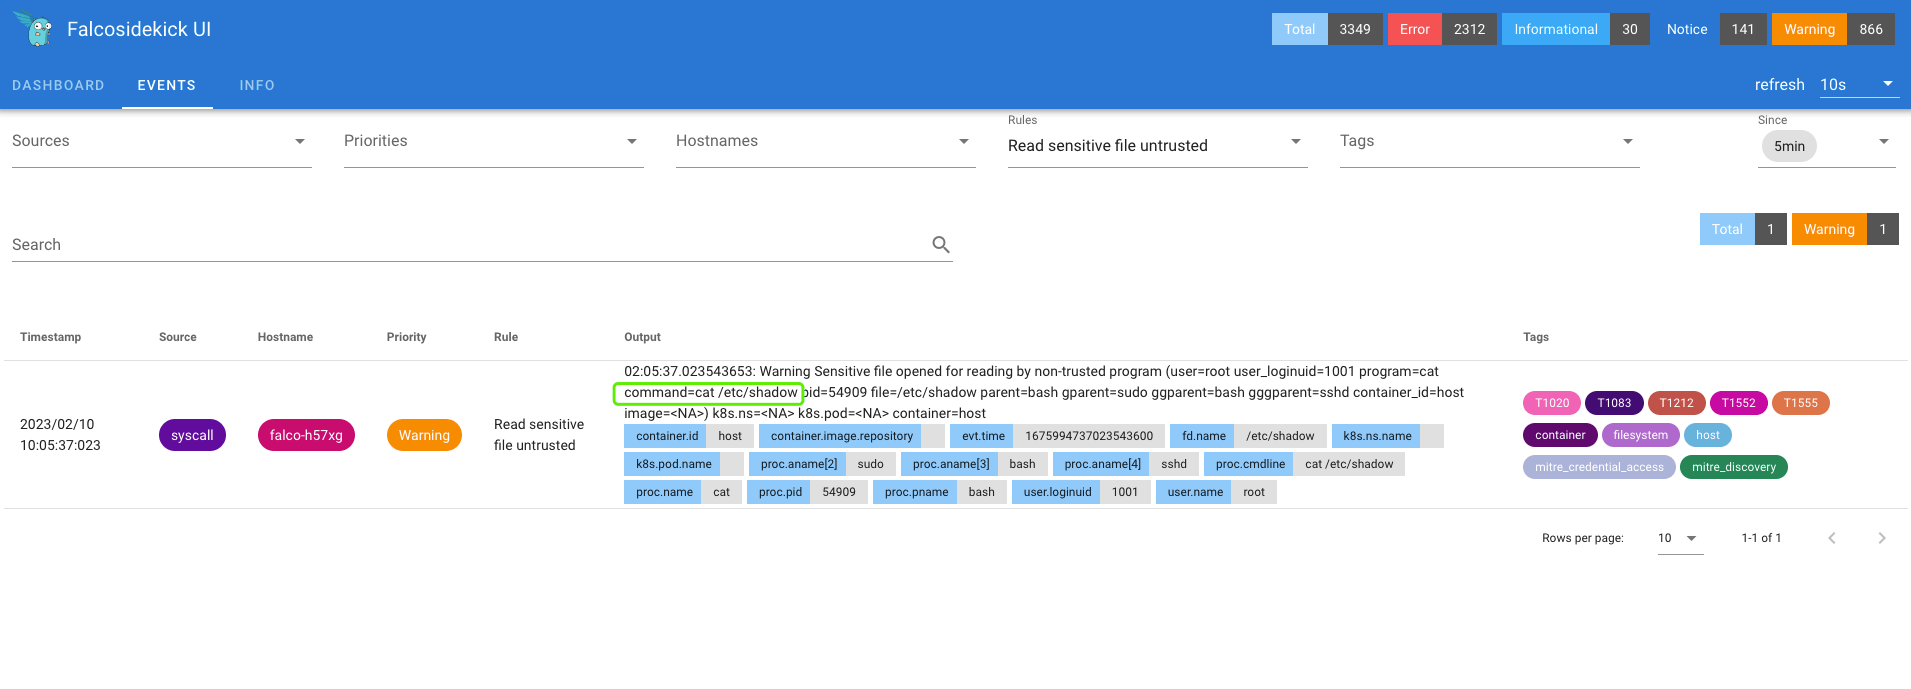
The Output content, since the operation is on the host, will be missing the cluster-related fields, but the file, command, and other information is considerably richer:
| |
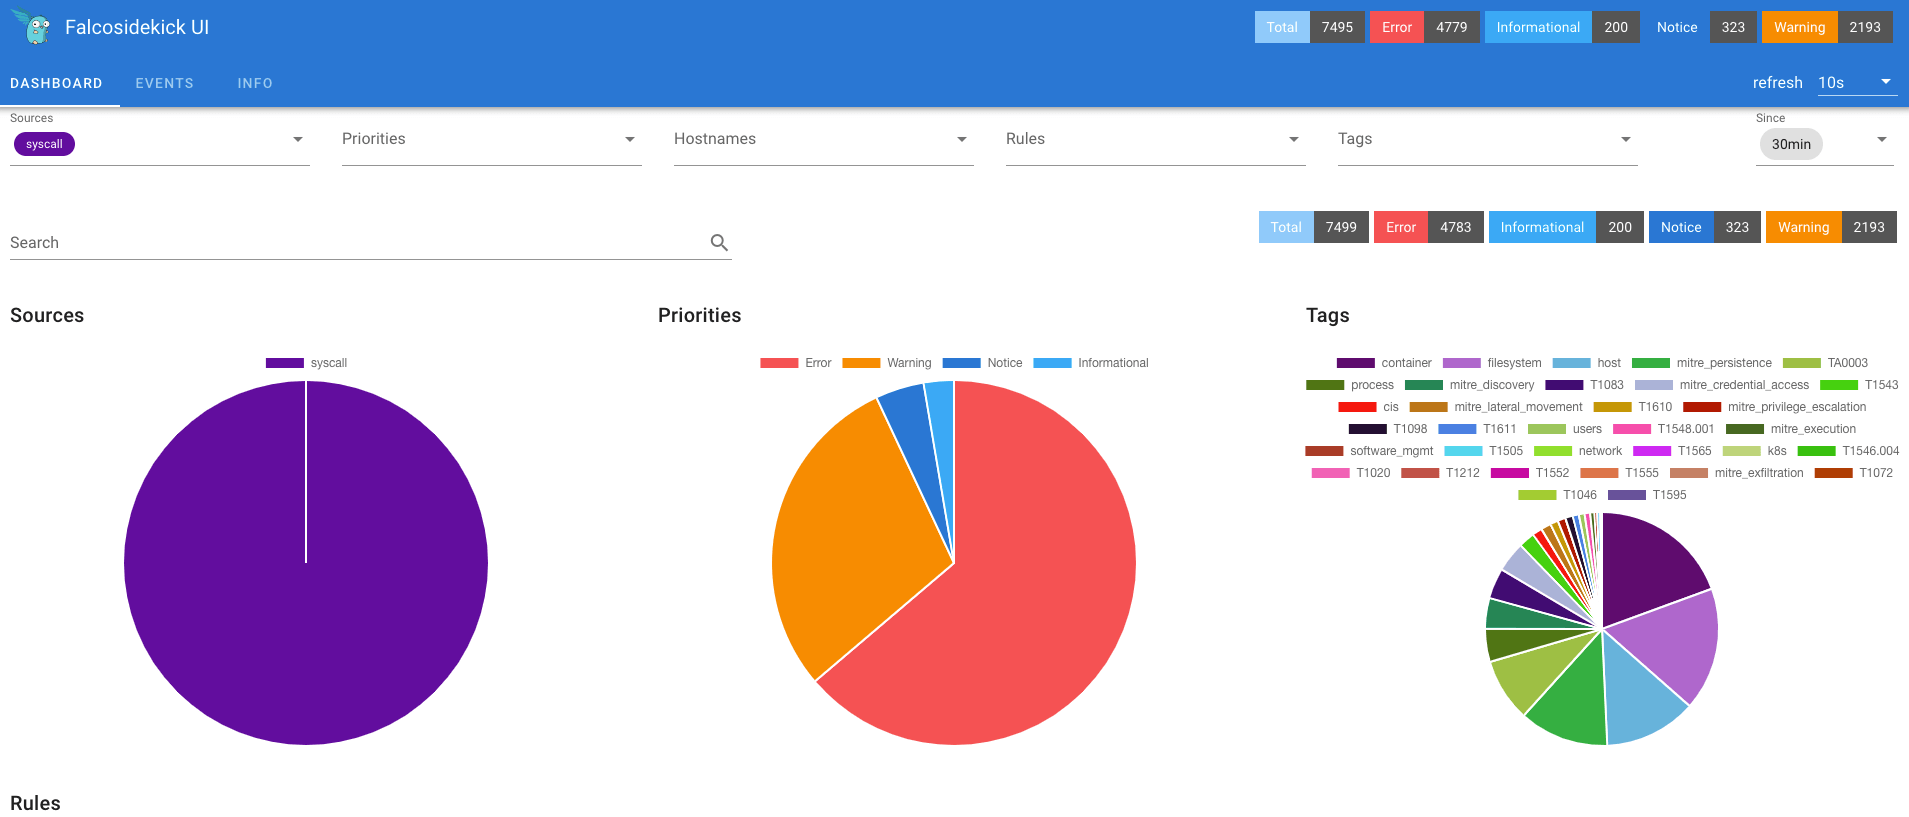
The Dashboard page provides a global statistics view, which lets you assess the security of clusters and hosts as a whole. The view is as follows: