1. Background
At 10:00 in the morning, a colleague asked me to run a task on the cluster, so I created a Kubernetes Job through a tool.
When the tool creates a Job, it first gets all the nodes on the cluster, then binds to each node one by one to create Jobs. For example, for the following cluster:
| |
The tool would then create 7 Jobs. Since master nodes are not allowed to be scheduled on in some clusters, the Job’s tolerations set a TaintEffectNoSchedule toleration to tolerate unschedulable nodes.
Here, node7 and node8 had actually already been shut down.
2. Incident Timeline
As expected, once the tool’s Job creation command finished, that should have been the end of it. But the story had only just begun:
- 10:31:02 The alerting system reported that a node’s 5-minute CPU load was too high
Using the top command, it quickly became clear that kube-controller-manager was consuming too much CPU. Associating this with the change at 10:00, I soon discovered that many Pods had been created for no apparent reason, and suspected that the sheer number of Pods was putting too much pressure on kube-controller-manager.
- 10:39:00 Started cleaning up Pods
This step was the beginning of the nightmare. From the monitoring data, in the half hour before the incident the machine’s CPU load had been rising slowly; the moment Pod cleanup began, the machine became completely unresponsive.
The reason was that I used kubectl delete pod to clean up the Pods. kubectl modifies etcd through kube-apiserver, and then kube-controller-manager completes the deletion tasks asynchronously.
But the key problem was that there were nearly 30,000 Pods, while the master nodes only had a 2C4G configuration. Deleting 30,000 Pods all at once triggered high load on
kube-controller-managerandEtcd, which directly made the nodes unresponsive. From the CPU usage chart in the monitoring graphs, it looked like this:
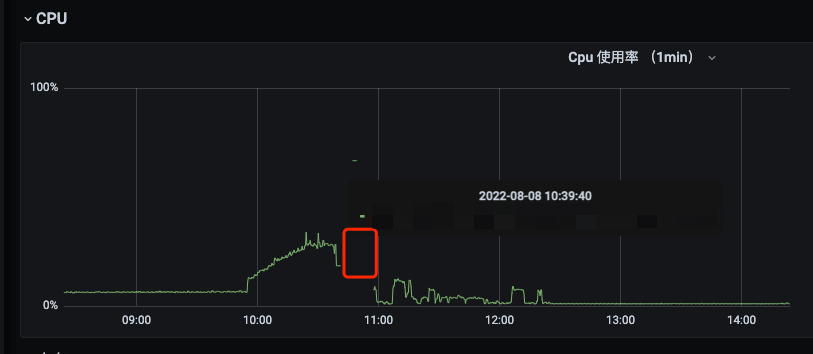
CPU usage represents the utilization rate of the CPU, whereas CPU load characterizes how busy the CPU is. For example, many low-compute-density tasks can lead to low CPU usage but very high CPU load. Here the CPU usage monitoring data simply disappeared, which means Prometheus could no longer scrape data from the host’s exporter.
- 11:05:00 Started scaling up the master nodes one after another
The cluster has 3 masters, and kube-controller-manager performs leader election; etcd is deployed on every master, so all master nodes needed their configuration upgraded, directly to the highest configuration the cloud vendor allows.
Note that you should not upgrade all three at the same time — wait for one to be ready before upgrading the next, because there are still many workloads on the cluster.
- 11:18:00 Upgrade completed, but errors persisted
kube-controller-manager and Etcd kept reporting errors, but the workloads were not affected.
- 12:24:00 Operated on etcd directly to clean up Pods and recover the cluster
Because I had ignored the order of magnitude of the Pod count, using kubectl to delete Pods and Namespaces never succeeded, and kube-controller-manager and Etcd kept reporting errors. Although the master nodes’ configuration had already been upgraded to a very high tier, it still did not solve the problem. I stayed here troubleshooting for a long time with no idea what to do. Finally I remembered that the complete loss of responsiveness had started when Pod deletion began, and only then found the approach: delete the Etcd data directly. A document I had written earlier contains some Etcd-related operational configuration: Etcd and etcdctl in Practice
Running the following commands to batch-delete the Pods under the xxx namespace solved the problem:
| |
3. Reflections
- Clean up the environment
Online operational work must be done carefully: not only must the accuracy of the result be ensured, but the after-effects of a change should also be eliminated as far as possible.
The oversight here was that I did not clean up the Job. If I had cleaned up the Job, the problem might not have occurred.
- A Kubernetes Job needs to set backoffLimit
In fact, both in Kubernetes 1.16 and on the master code branch, you can see that the default backoffLimit is 6, meaning the Job will retry 6 times and run at most 7 times. The tool omitted this parameter when creating the Job:
| |
But on a node that had been shut down, the default backoffLimit did not take effect; instead, Pods were created nonstop at an extremely fast rate, and over more than an hour the two Jobs retried nearly 30,000 times in total.
- Still pending reproduction and further tracking
The scenario is not easy to reproduce: Kubernetes 1.16, multiple master nodes, a worker node shut down, a Job with no backoffLimit set, and a Job with nodeName set directly. Experiments are still ongoing, and I will keep following up.
