The Merrill Lynch Investment Clock theory is a method that links assets, industry rotation, the bond yield curve, and the four stages of the economic cycle. It is a very practical tool for guiding investment cycles.
The analytical framework of the Merrill Lynch Investment Clock can help investors identify the important turning points of the economic cycle. And by correctly identifying the inflection points of economic growth, investors can switch assets to realize profits.
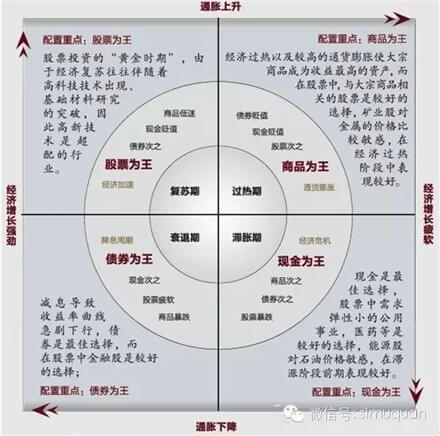
According to different combinations of economic growth and inflation, the Merrill Lynch Investment Clock theory divides the economic cycle into four stages:
- “Economic growth up, inflation down” constitutes the recovery stage. In this stage, because stocks have greater elasticity to the economy, they clearly deliver excess returns relative to bonds and cash;
- “Economic growth up, inflation up” constitutes the overheating stage. In this stage, rising inflation increases the opportunity cost of holding cash, the interest rate hikes that may be introduced reduce the attractiveness of bonds, the allocation value of stocks is relatively strong, and commodities will clearly enter a bull market;
- “Economic growth down, inflation up” constitutes the stagflation stage. In the stagflation stage, cash yields rise and holding cash is the wisest choice, the impact of an economic downturn on corporate profits will have a negative effect on stocks, and the yield of bonds relative to stocks rises;
- “Economic growth down, inflation down” constitutes the recession stage. In the recession stage, inflationary pressure falls, monetary policy becomes looser, bonds perform most prominently, and as the expectation that the economy is about to bottom gradually forms, the attractiveness of stocks gradually increases.
The performance of returns across the four stages is as follows:
- Recession: bonds > cash > stocks > commodities
- Recovery: stocks > bonds > cash > commodities
- Overheating: commodities > stocks > cash/bonds
- Stagflation: cash > commodities/bonds > stocks
Therefore, what investment strategy should we apply in different stages to achieve the optimal investment objective:
- Cyclicality: when economic growth accelerates (north), stocks and commodities perform well. Cyclical industries, such as high-tech stocks or steel stocks, outperform the broader market. When economic growth slows (south), bonds, cash, and defensive portfolios outperform the broader market.
- Duration: when the inflation rate falls (west), the discount rate falls and financial assets perform well. Investors buy long-duration growth stocks. When the inflation rate rises (east), real assets, such as commodities and cash, perform well. Value stocks with low valuation volatility and short duration outperform the broader market.
- Interest-rate sensitivity: banks and consumer discretionary stocks are interest-rate sensitive and react earliest within a cycle. They perform best in the recession and recovery stages, when the central bank loosens monetary policy and growth begins to recover.
- Correlation with the underlying asset: the performance of some industries is linked to the price trend of the underlying asset. Insurance stocks and investment bank stocks tend to be sensitive to bond or equity prices and perform well in the recession or recovery stages. Mining stocks are sensitive to metal prices and perform well in the overheating stage. Oil and gas stocks are sensitive to oil prices and outperform the broader market in the stagflation stage
