I recently had a requirement to collect Kubernetes’ external network access. So I set up and tried out some related projects. This post is mainly about how to install Kindling and configure Grafana to view Kubernetes network connection data.
1. What Is Kindling
Kindling solves the problem of how to observe the network without intruding on the application; its functionality is mainly achieved by exposing kernel events for observation. If the host kernel version is higher than 4.14, you can use the eBPF module; if the host kernel is an older version, it uses Sysdig for the relevant observation.
Here is an architecture diagram:
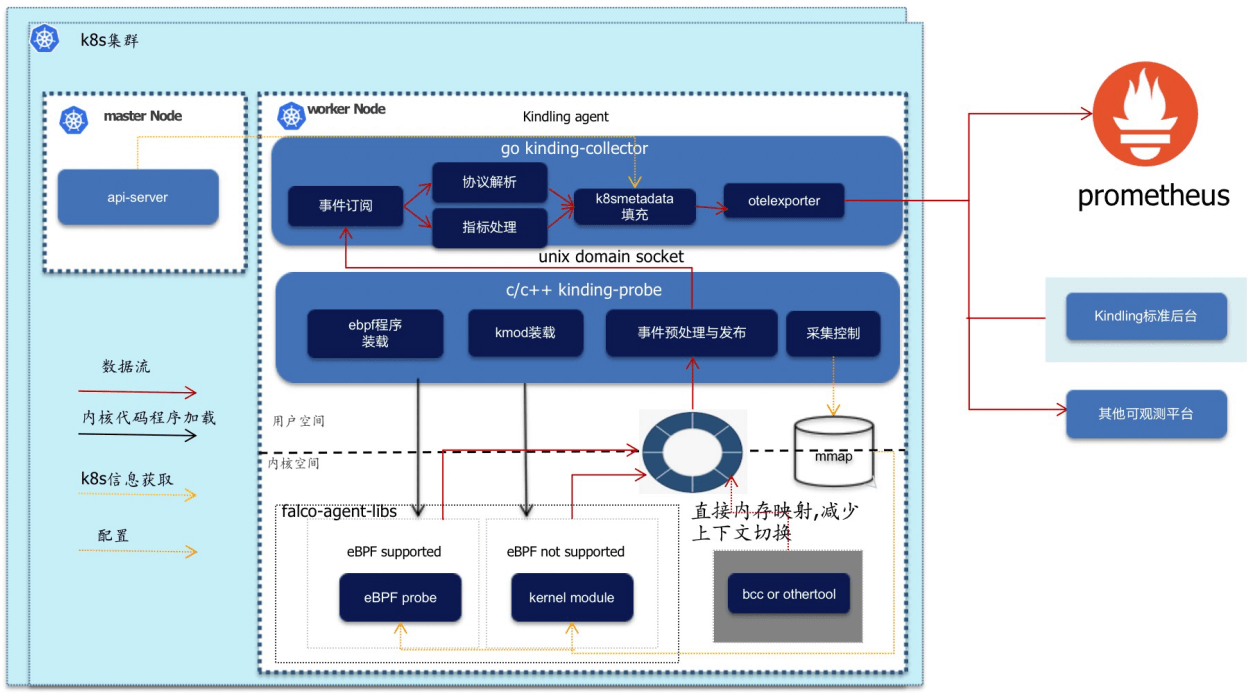
Kindling currently has two versions, one open-source and one commercial. The open-source version does not collect detailed enough data and can only produce Grafana charts; the commercial version has enhanced functionality, which is introduced on the project’s GitHub homepage, so I will not repeat it here.
This kind of technology — based on eBPF, converting kernel function calls into userspace events and then exposing them to user programs — should have some real-world use cases in the coming years, and will also be quite interesting. So let’s do a simple deployment and try out the open-source version of Kindling.
2. Installing Kindling
The Kindling open-source community does not operate particularly well, and its documentation and materials are not clear enough, so I put together a Yaml file for installation.
2.1 Make Sure the Kernel Version Is Greater Than 4.14
| |
2.2 Download the Yaml File
| |
2.3 Install Kindling
| |
2.4 Check the Pod Status
| |
2.5 The Pod May Stay in CrashLoopBackOff
If the Pod stays in CrashLoopBackOff, this is caused by a mismatch between the kindling-agent image and the current system. You need to recompile the image:
- Install kernel headers
On Ubuntu, run:
| |
On CentOs, run:
| |
- Compile and generate a new image
| |
- Tag the image as the one defined in the Yaml
| |
- Just restart the Pod
| |
- A trick when replacing the kindling-agent image
You need to change the kindling-agent’s image pull policy to IfNotPresent.
| |
Note here that if your infrastructure is fairly uniform, with only one operating system and one kernel version, you can tag the image as your own private image, push it to a remote registry, and simply modify the kindling-agent Daemonset image address.
If your infrastructure is not uniform, and one cluster contains multiple kinds of hosts, operating systems, and kernel versions, you can compile them one by one on those special systems. Since a Daemonset can only set one image name, you need to keep the image name of the kindling-agent recompiled on all Kubernetes nodes consistent.
3. Installing the Grafana Plugin and Importing the Dashboard
3.1 Install the topo-plugin Plugin
Since the Grafana I usually use is deployed with Docker, the plugin installation process is slightly more complicated.
- Download the plugin
| |
- Copy the plugin into the container
| |
Here 392fe26ae57f is the container ID that Grafana is running in.
- Enter the container and create a directory
| |
- In the container, create a directory and extract the plugin
| |
- Configure the plugin
/etc/grafana/grafana.ini is a read-only file, so you need to copy it outside the container, modify it, and then copy it back to overwrite the original file.
| |
Edit the grafana.ini file locally and add the following content
| |
Copy the modified grafana.ini file back into the container to overwrite the original file
| |
- Restart Grafana
| |
3.2 Import the Grafana Dashboard
The Grafana version I use is 8.3.1.
The related Dashboard Json files are backed up at https://github.com/shaowenchen/demo/tree/master/kindling/dashboard.
Compared with the Dashboard officially provided by Kindling, the main addition is a DataSource field for switching data sources, which makes it convenient to view monitoring data on different clusters.
4. Viewing the Data Reported by kindling-agent
Here are the screenshots:
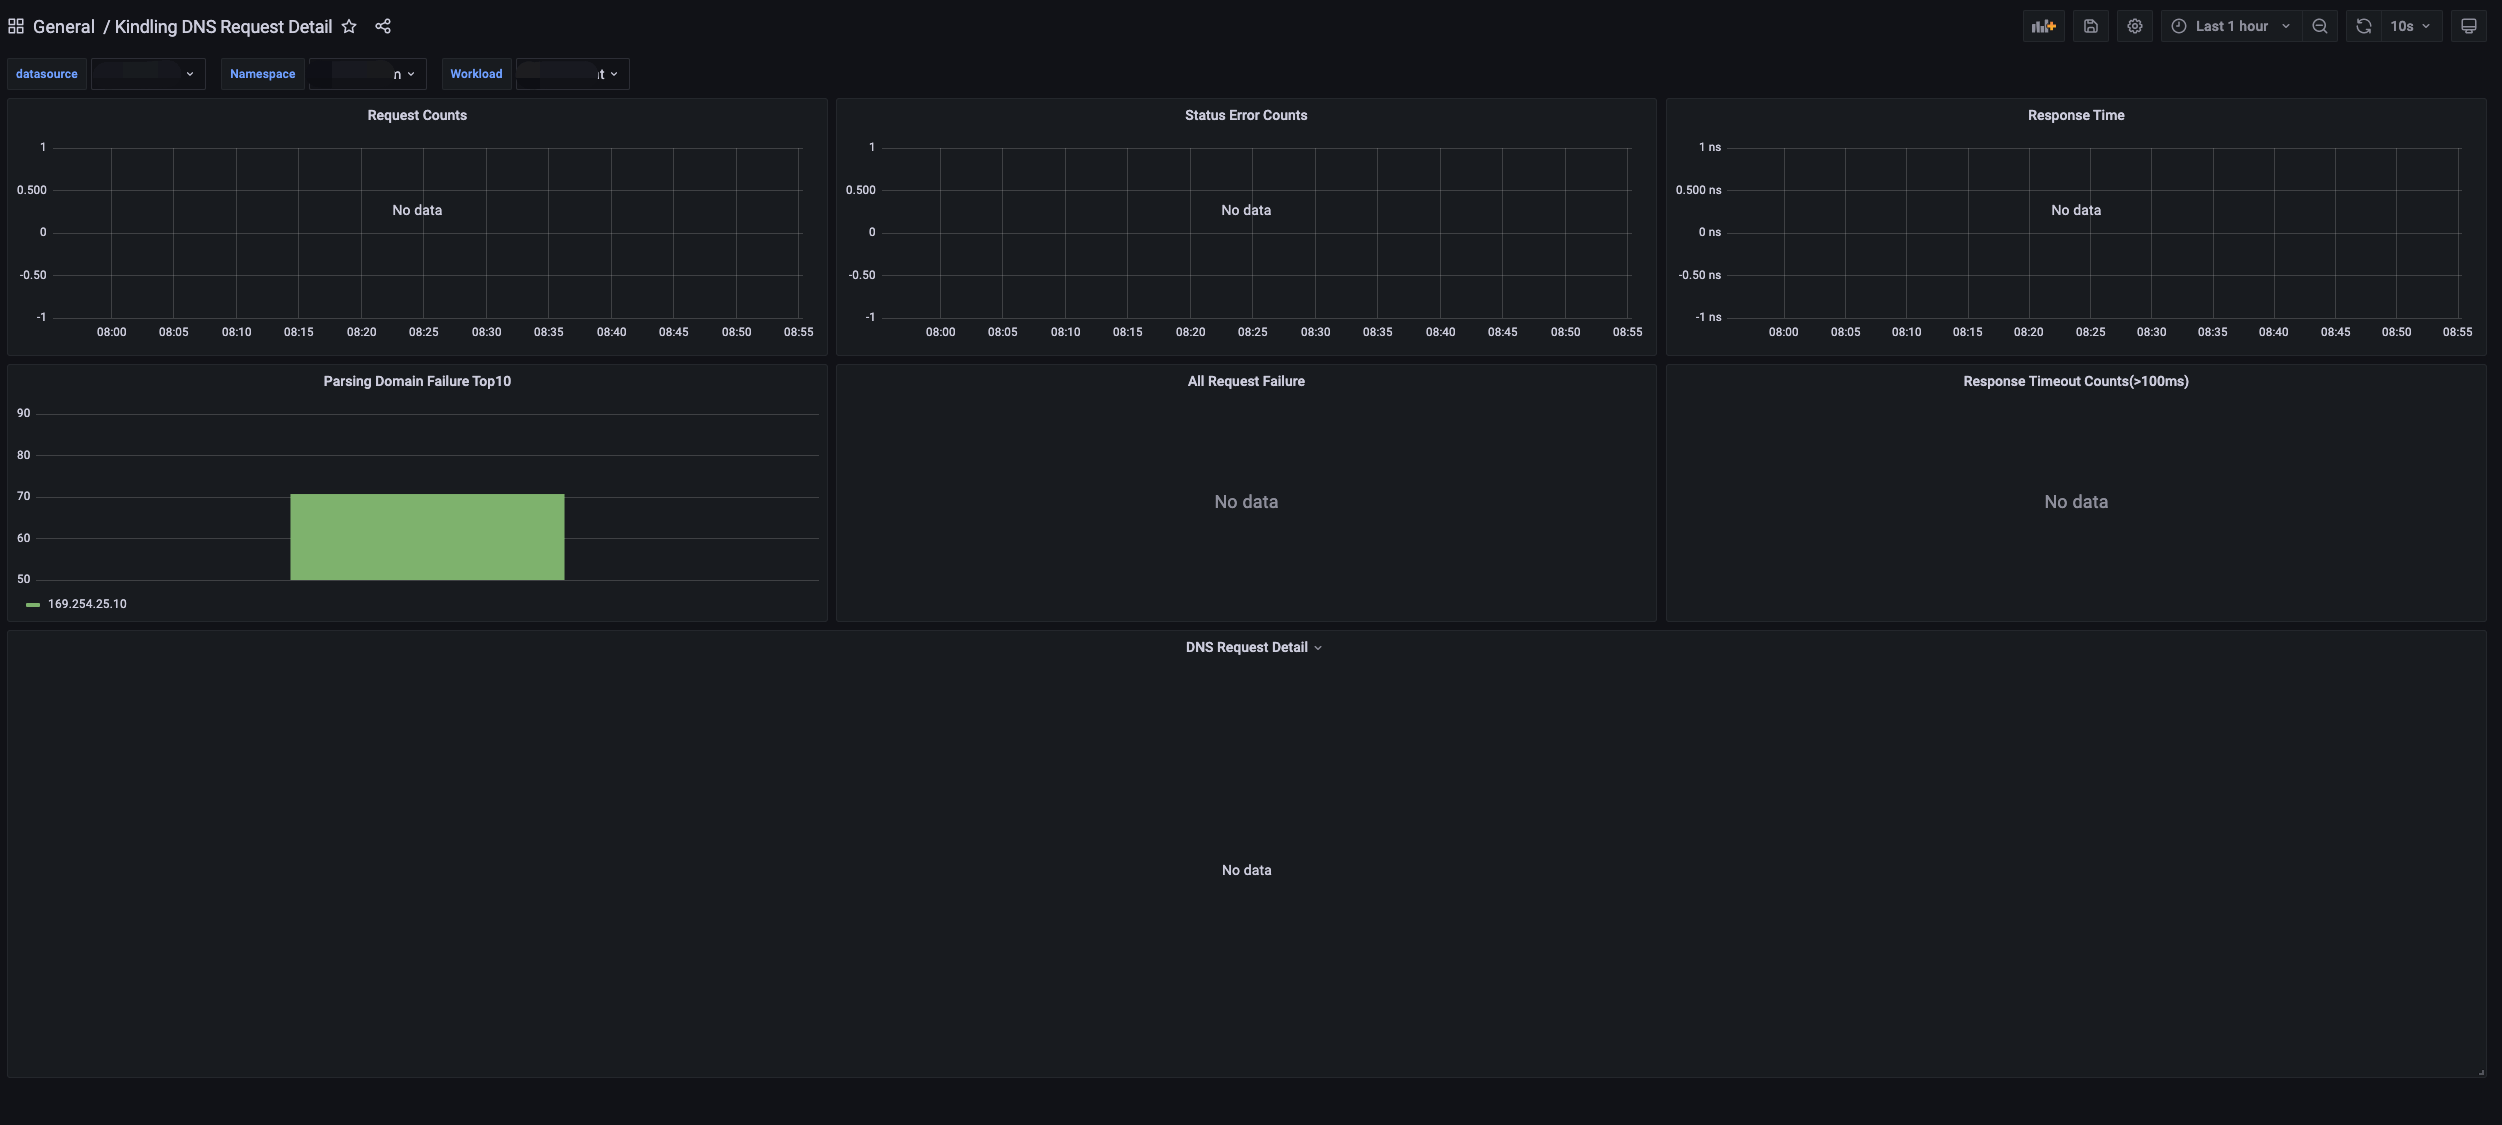
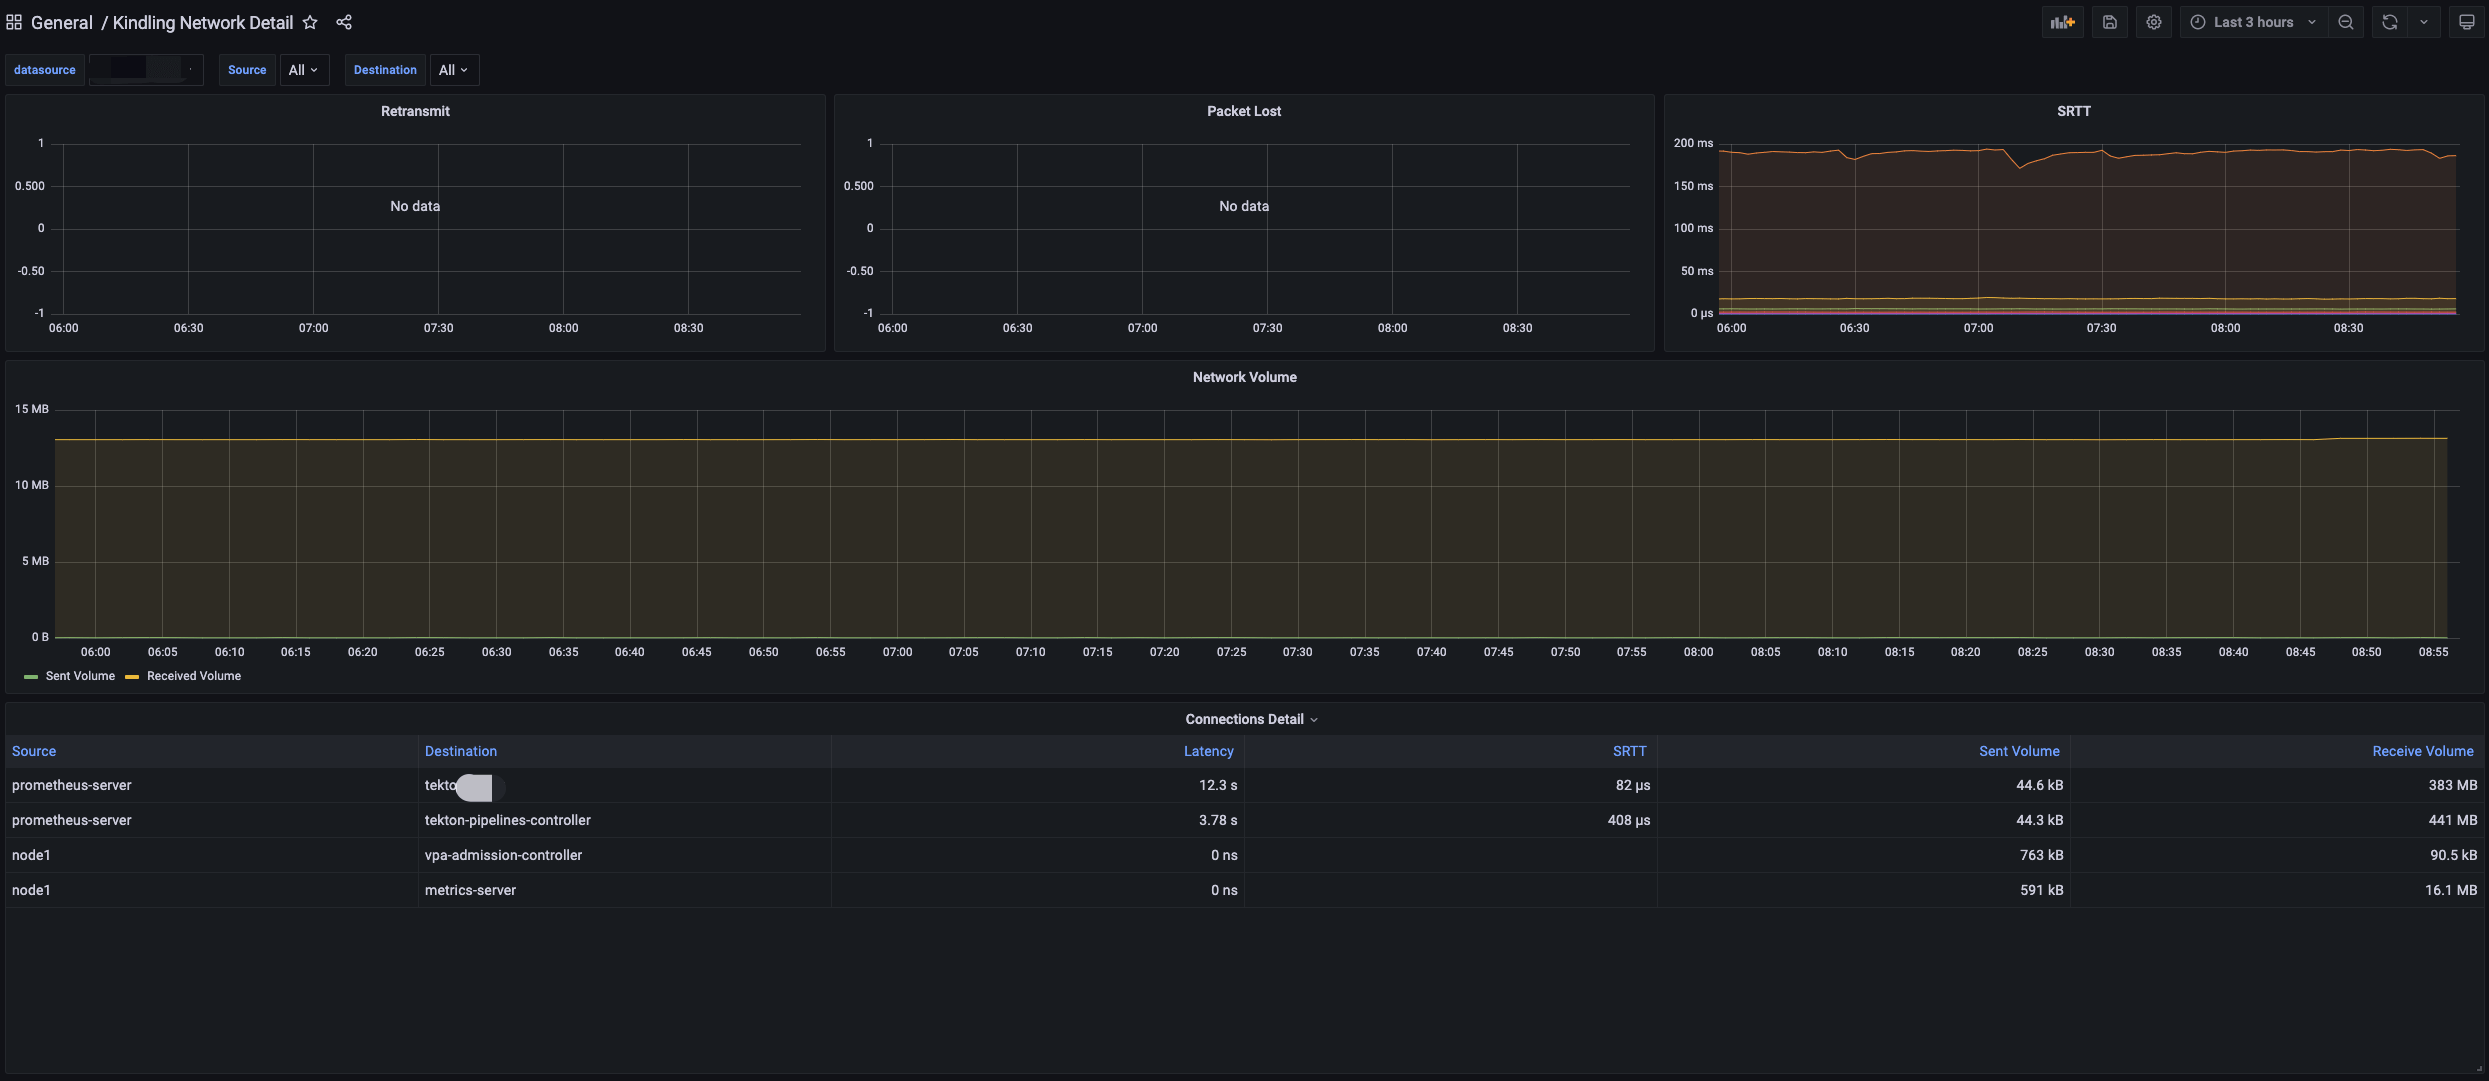
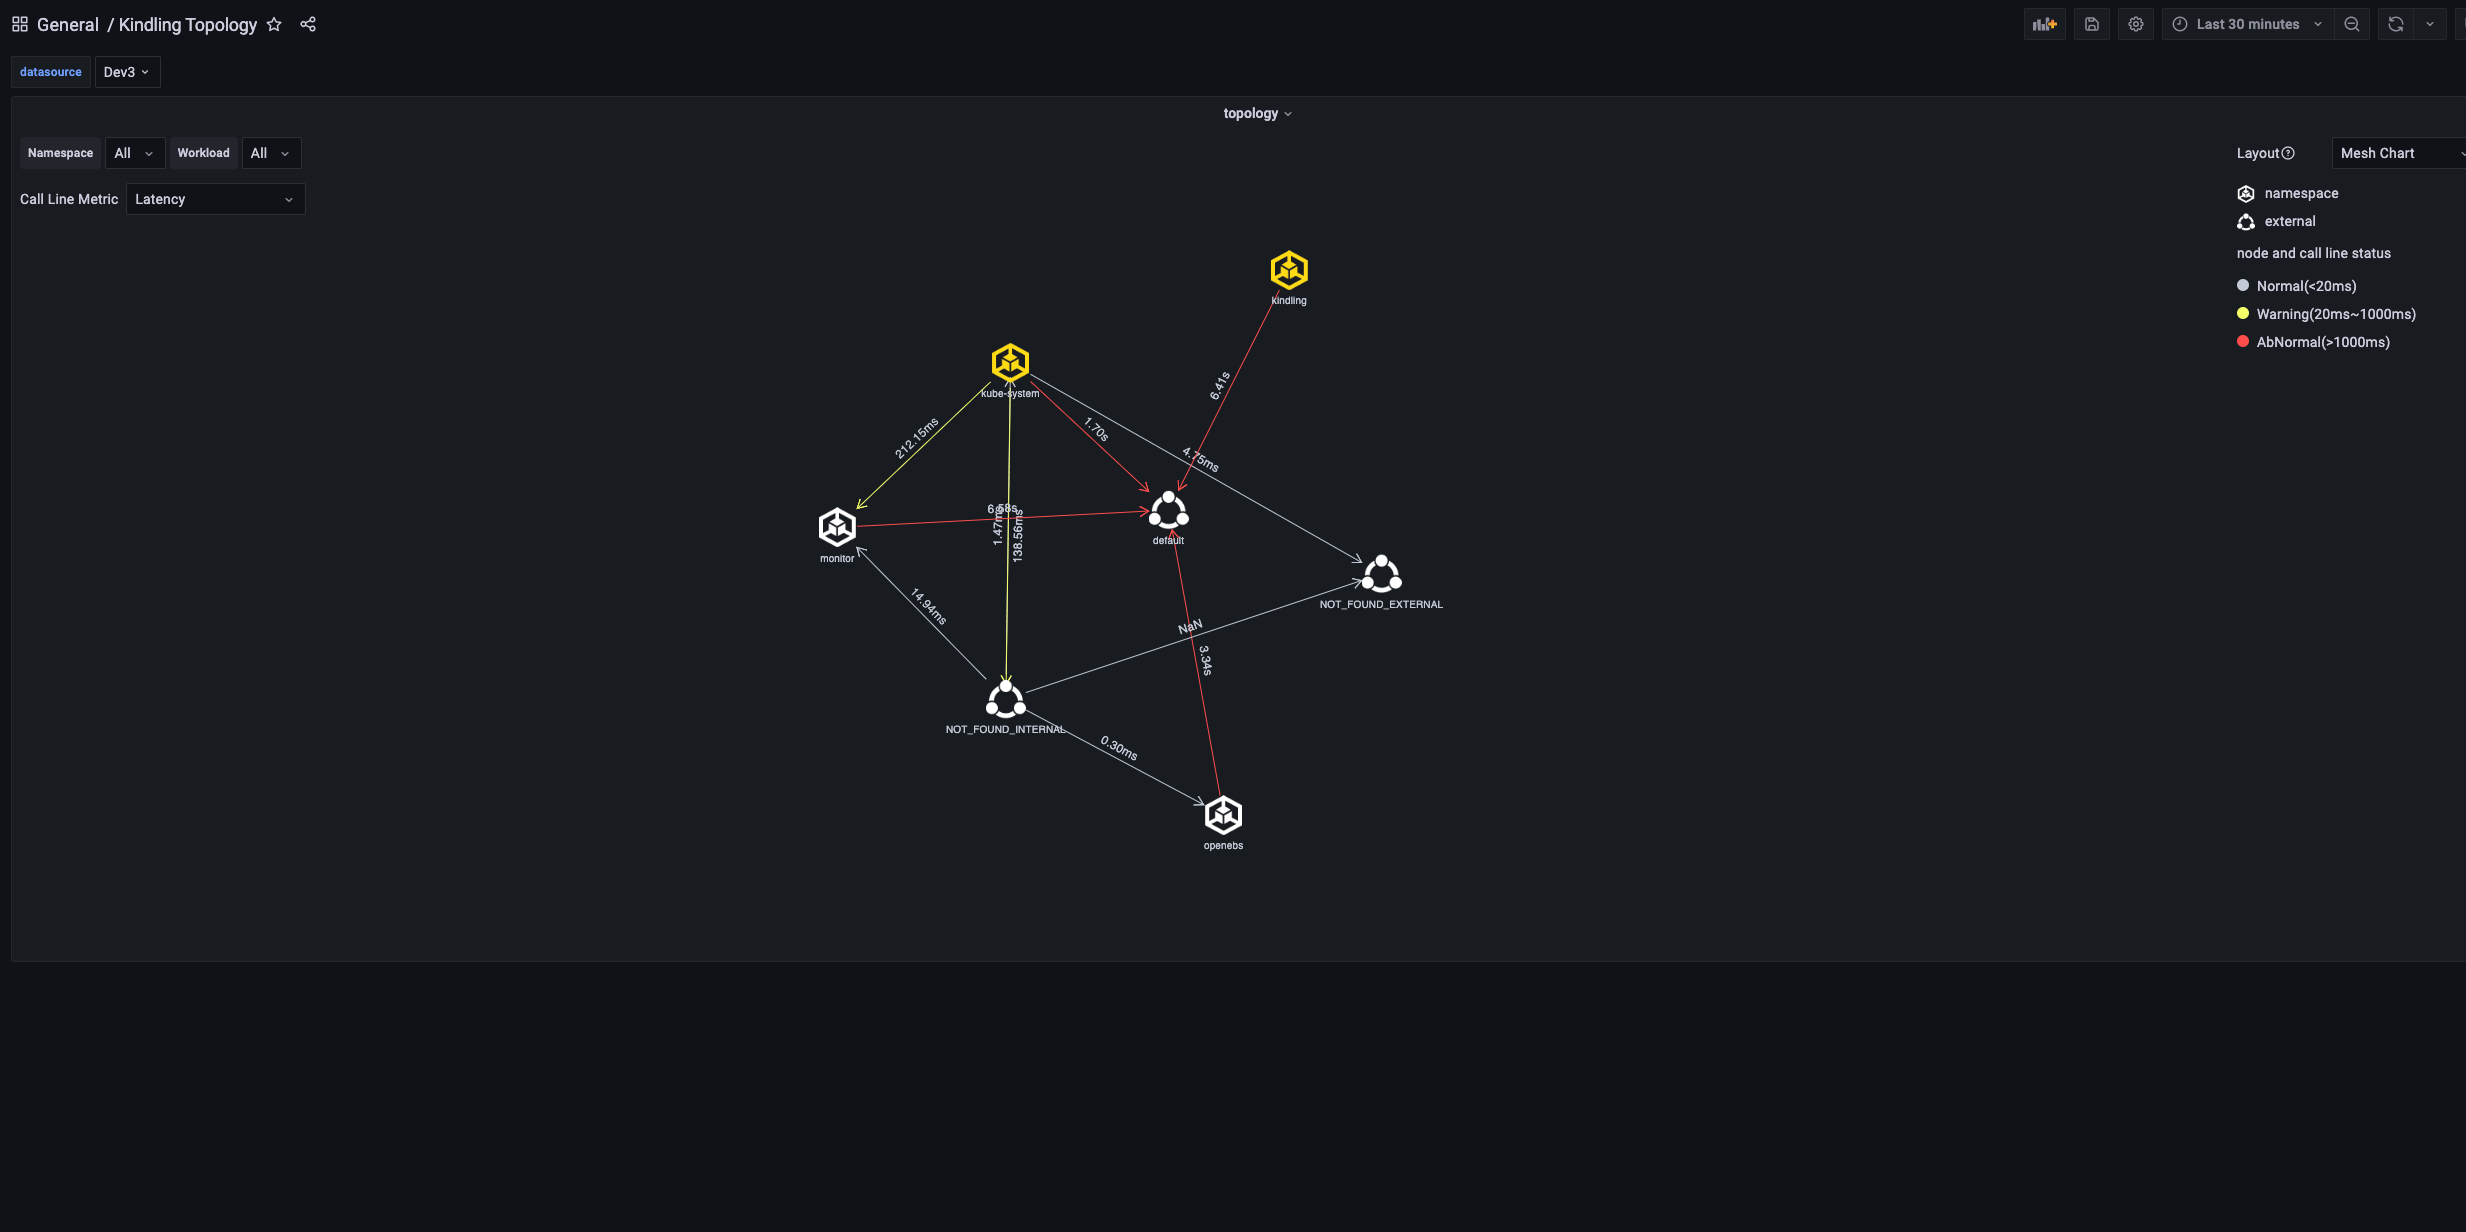
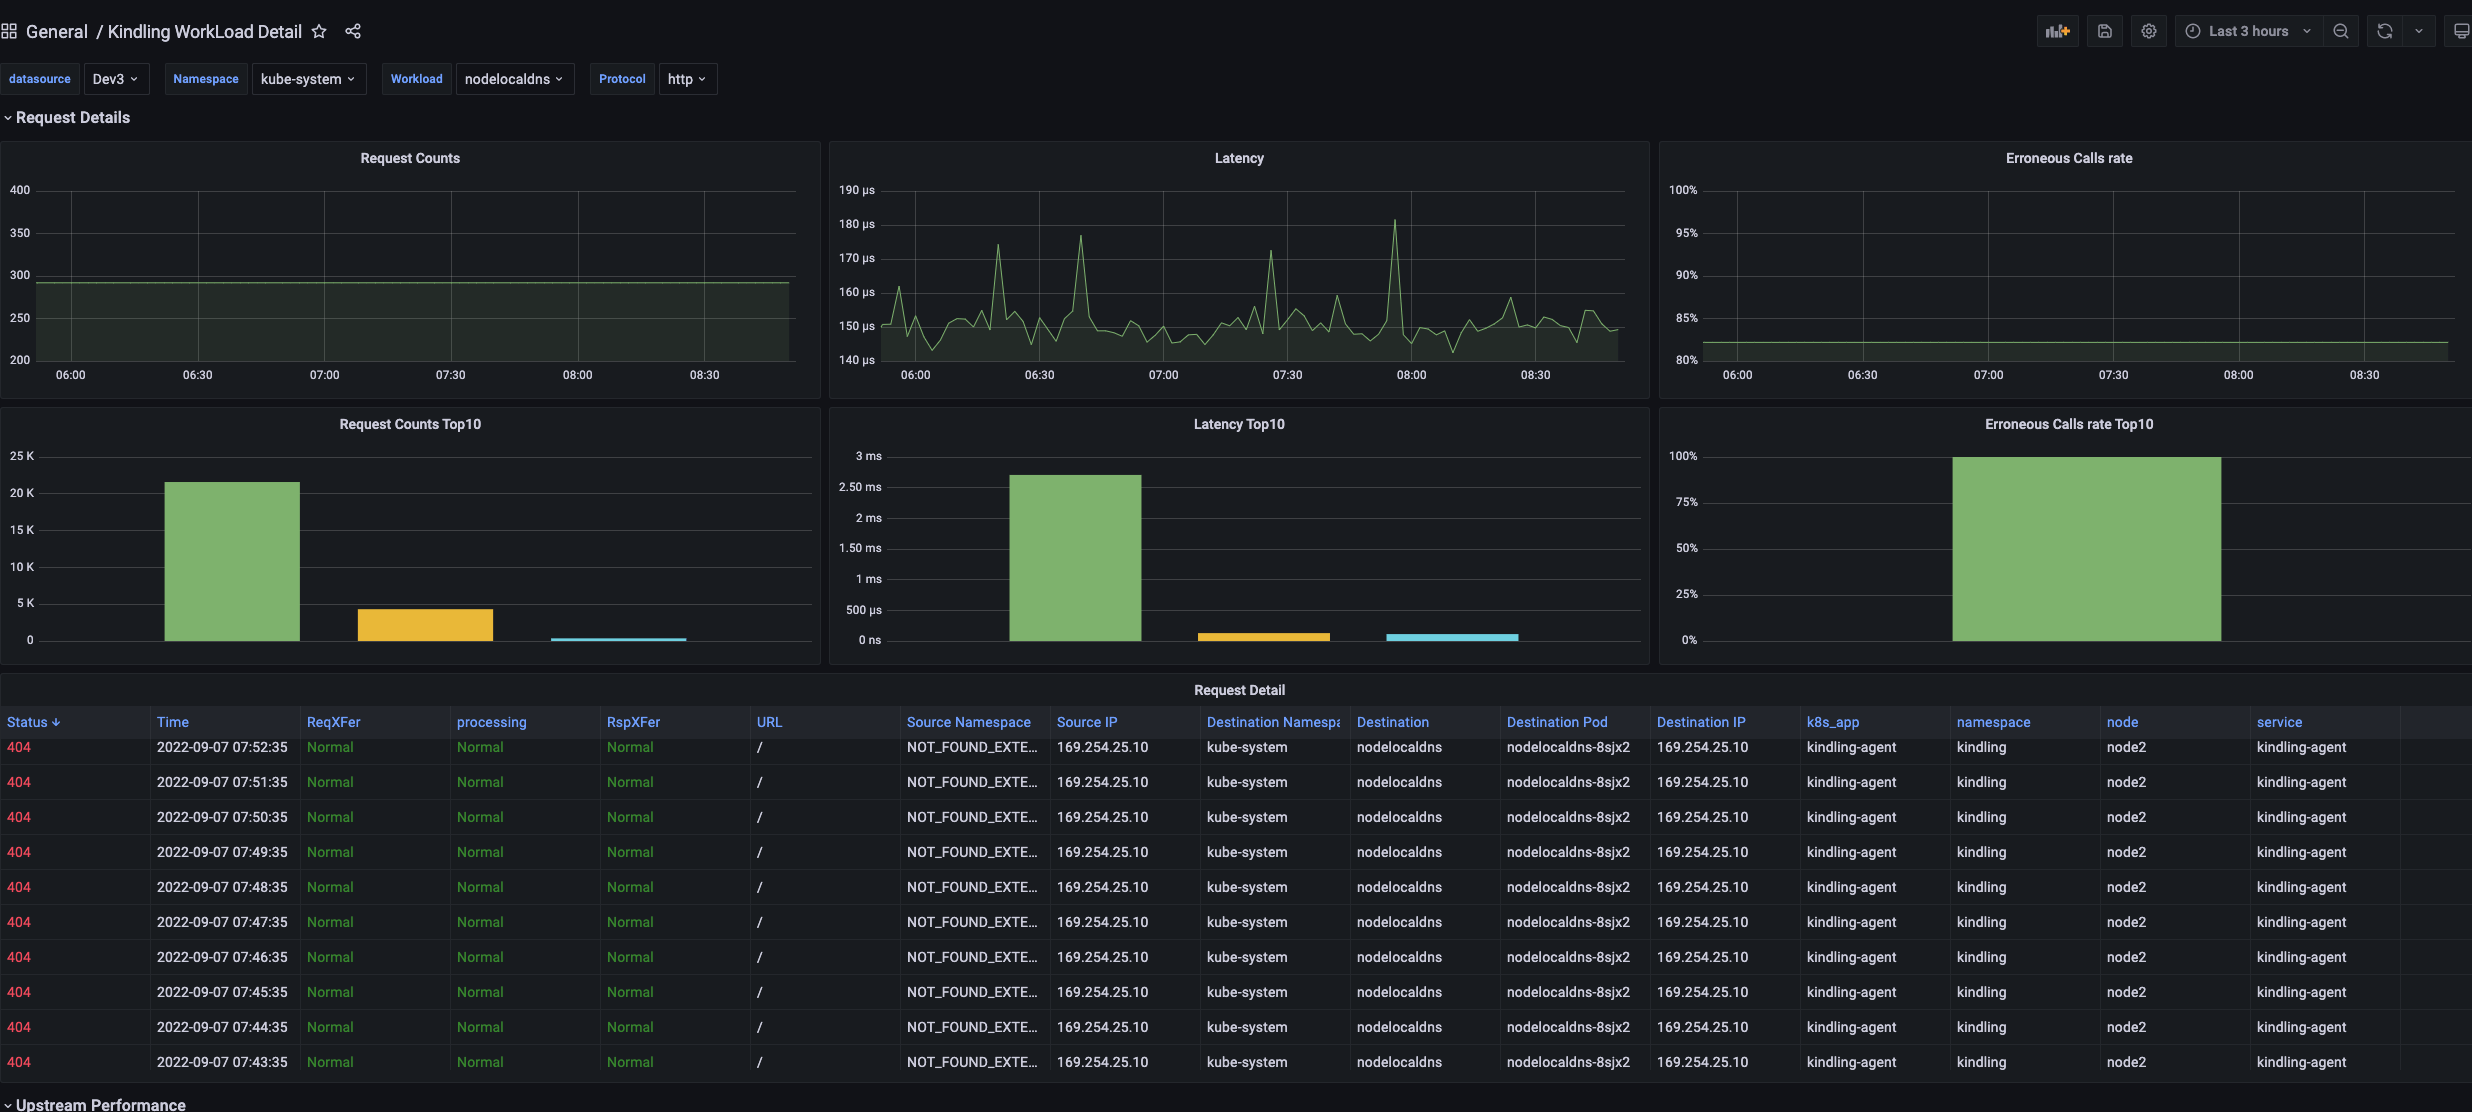
On the dashboard you can see some DNS and four-tuple related information, and even the network topology between namespaces and Services. The resource consumption is also acceptable:
| |
In some of the charts above, you can find that some data is missing, and some fields show NOT_FOUND_INTERNAL, so the project’s experience is not particularly good.
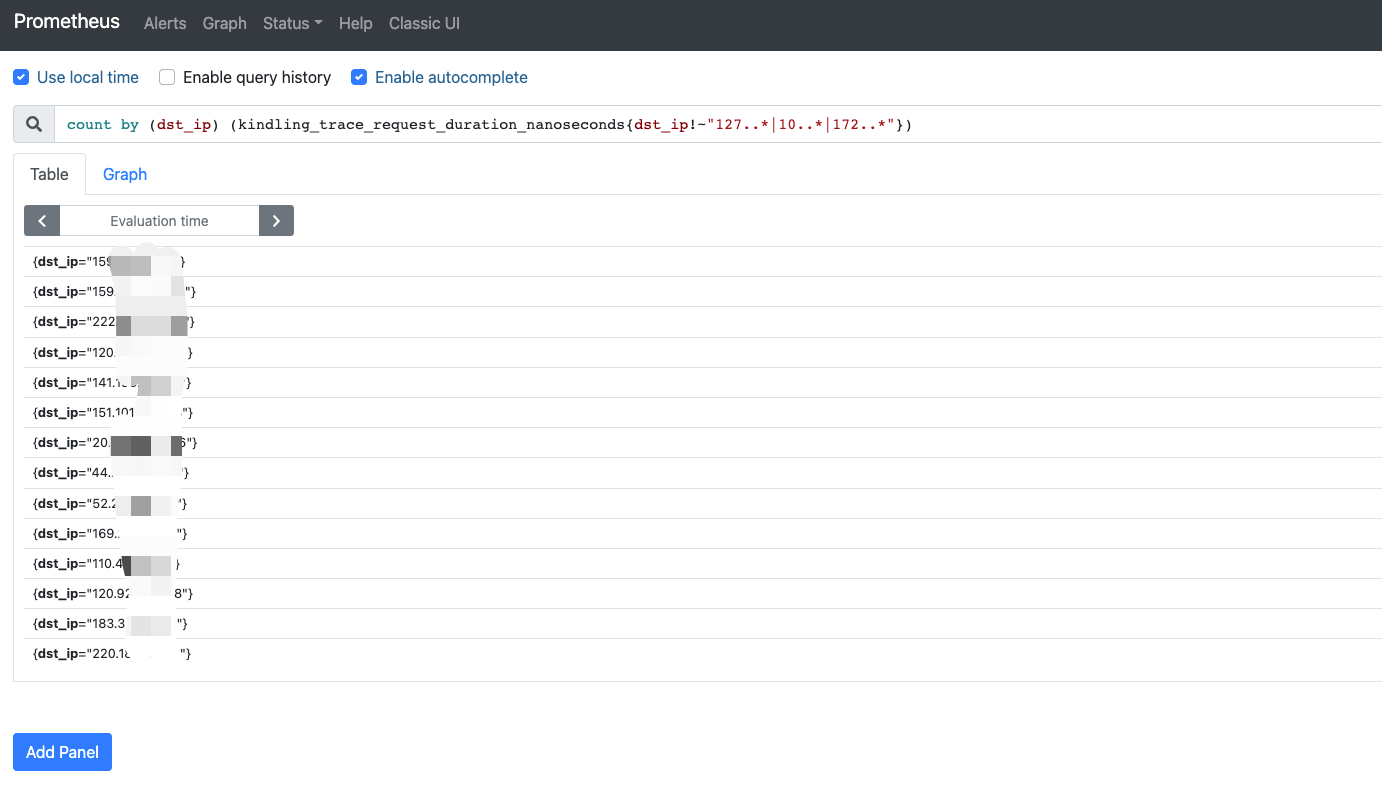
Through a PromQL statement, I obtained the list of IPs that the cluster accesses externally.
| |