1. Business Background
Once an enterprise reaches a certain scale, relying entirely on public cloud infrastructure makes IT costs very high.
The cost of purchasing physical machines can be amortized over the next 3 to 5 years, and afterwards the machines are not scrapped; instead they continue to serve beyond their planned lifespan. A private cloud requires a certain allocation of operations staff, purchased dedicated line bandwidth, data center fees, and so on, so IT services need to reach a certain scale before the costs can be effectively reduced.
That is why only medium and large enterprises adopt a hybrid cloud approach, deploying part of their applications on the public cloud and part on the private cloud. This has also driven the growth of managed cloud services, where cloud vendors offer services for managing private machines so that they can be quickly connected to their own public cloud services.
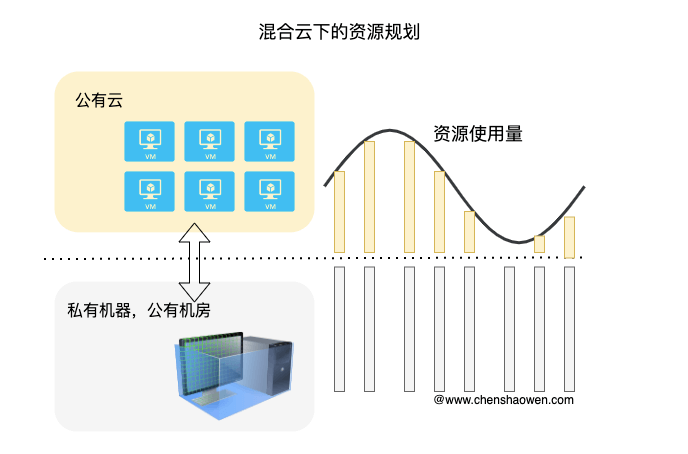
As shown in the figure above, the machines in the private cloud are used to meet the baseline business resource requirements, while the machines in the public cloud are used to supplement resource requirements during business peaks. And Kubernetes, as the infrastructure, naturally also needs to adapt to hybrid cloud scenarios.
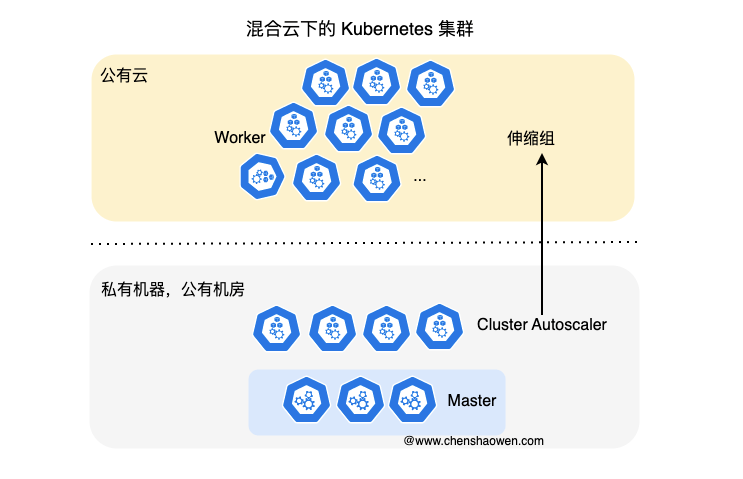
As shown in the figure above, this is a Kubernetes cluster under a hybrid cloud, with a private data center (Master + some Workers) plus a public cloud (some Workers). The Cluster Autoscaler component is used to connect to the public cloud’s elastic scaling group service, scaling Worker nodes up or down on demand.
The cost of private cloud machines is basically fixed, while the cost of public cloud machines is billed on demand. Reducing the use of public cloud machines as much as possible while guaranteeing the business SLA is what I have been working on recently.
2. Why Request Is So Important
2.1 It Helps Balance Scheduling
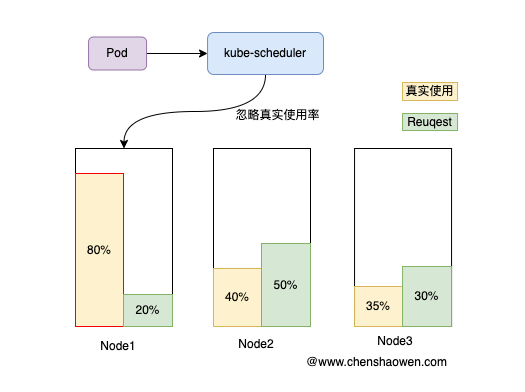
Request is the requested amount of a resource. As shown in the figure above, when the scheduler is choosing a suitable Node for a Pod, the smaller the total Request of the Pods on a Node, the higher the score, and the more likely it is to be selected.
If you set a very low Request for every Pod, you will find scheduling is very uneven: some nodes have a high load, but the scheduler still chooses these nodes.
This is because the default scheduler is a static scheduler; it only looks at Request and the total Request on a Node, without considering the actual usage.
Request guarantees that the current application is allocated enough resources and is meant to protect the application itself; Limit is meant to restrict the current application and is meant to protect other applications.
You can skip setting Limit, but you must set Request.
2.2 HPA Scales Based on the Request Value
The formula HPA uses to calculate resource utilization is:
currentUtilization = int32((metricsTotal * 100) / requestsTotal)
When utilization exceeds the threshold, HPA increases the number of Pod replicas. And the Total here means that HPA calculates the resource consumption of all Pods.
There are two issues worth thinking about here
- A single Pod may have multiple containers, with one container at 90% utilization and another at 10% utilization
Kubernetes v1.27 has a Beta feature, ContainerResource, which lets you specify a container as the calculation target while ignoring other containers such as sidecars.
- The resource consumption of multiple Pods differs, with one Pod at 90% utilization and another at 10% utilization
From the R&D side, when developing an application you should consider the balance across multiple replicas and avoid a situation where a single replica carries too heavy a task. If the imbalance is caused by long connections, there should be a rebalancing mechanism. At the same time, graceful restart should also be supported, so that when a Pod with an excessive load is killed, it does not affect the service’s SLO.
From the operations side, you can appropriately lower the Limit value and let requests be spread to other Pods by killing the Pod.
3. How to Set Request and Limit
3.1 Setting Request
As mentioned earlier, Request is meant to protect the current application and should be able to meet the application’s basic usage. But if Request is too high, it will lead to wasted resources.
- CPU
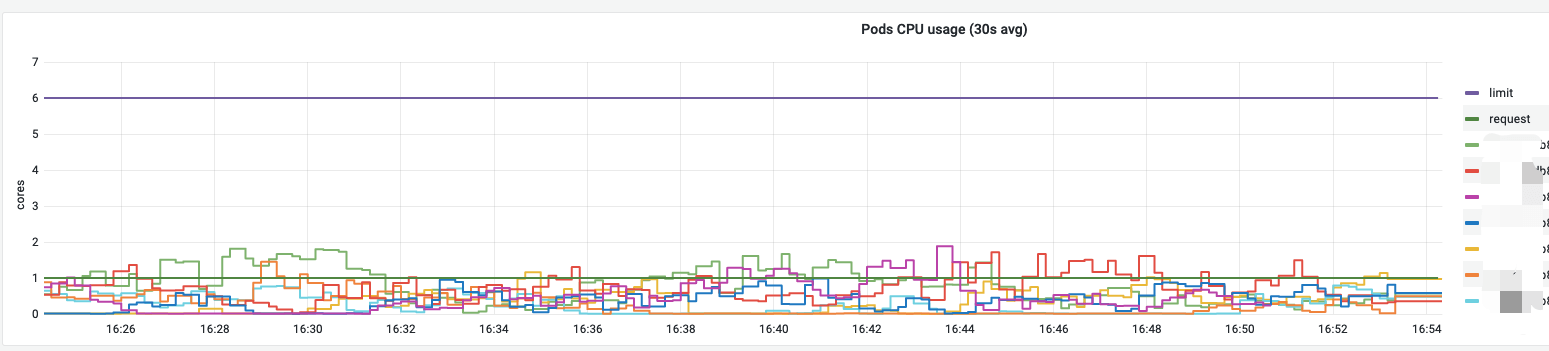
As shown in the figure above, Request should cover CPU usage for most of the time.
clamp_min(max(quantile_over_time(0.6, irate(container_cpu_usage_seconds_total{cluster="$cluster", namespace="$namespace", deployment="$deployment"}[2m])[1w:2m])), 0.5)
The quantile_over_time function computes the 60th percentile usage requirement, and the clamp_min function sets the minimum value to 0.5.
- Memory

clamp_min(max(quantile_over_time(0.8, max(sum (container_memory_working_set_bytes{cluster="$cluster",image!="",name=~"^k8s_.*", namespace=~"$namespace", deployment=~"$deployment"}) by (pod)))[1w:2m]), 500 * 1024 * 1024)
Memory is an incompressible resource, so a relatively high Request needs to be set to guarantee the normal operation of the application. Therefore, the percentile set here is higher than that for CPU.
3.2 Setting Limit
Setting Limit is meant to protect other applications, so that when the current application consumes too many resources it does not affect the normal operation of other applications.
- CPU
As shown in the figure below, applications often run into a situation where the CPU utilization is very low but CPU throttling is severe, requiring the CPU Limit to be raised again and again, while an excessively high Limit leads to node instability. At the same time, some billing systems charge based on Limit, and an excessively high Limit increases business costs.
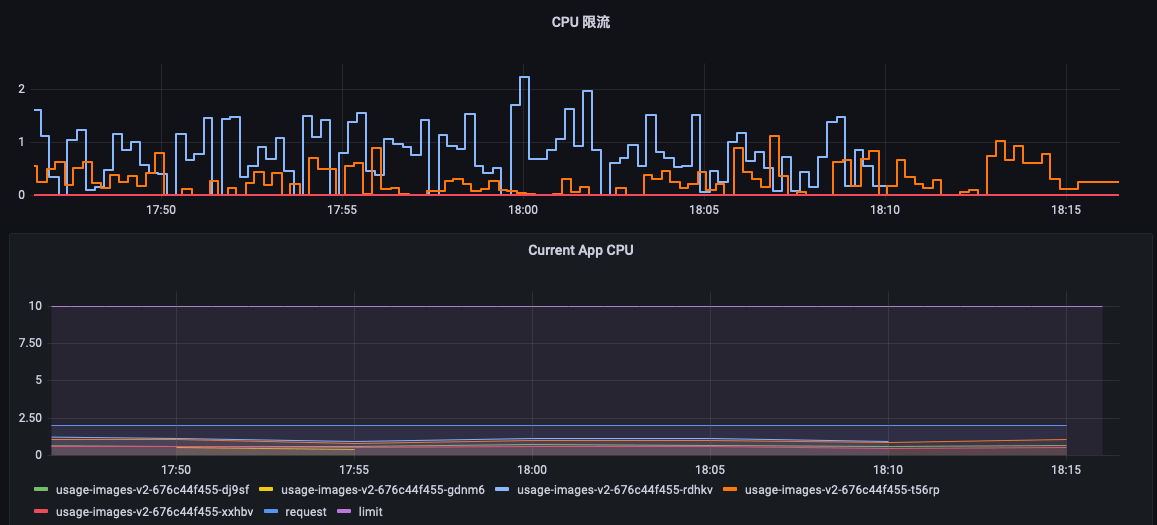
This situation occurs because Prometheus has a sampling interval of 15s, which is too coarse a monitoring granularity to capture real-time CPU usage. And if the monitoring data were collected at 1s or 100ms intervals, it would very likely look like this.
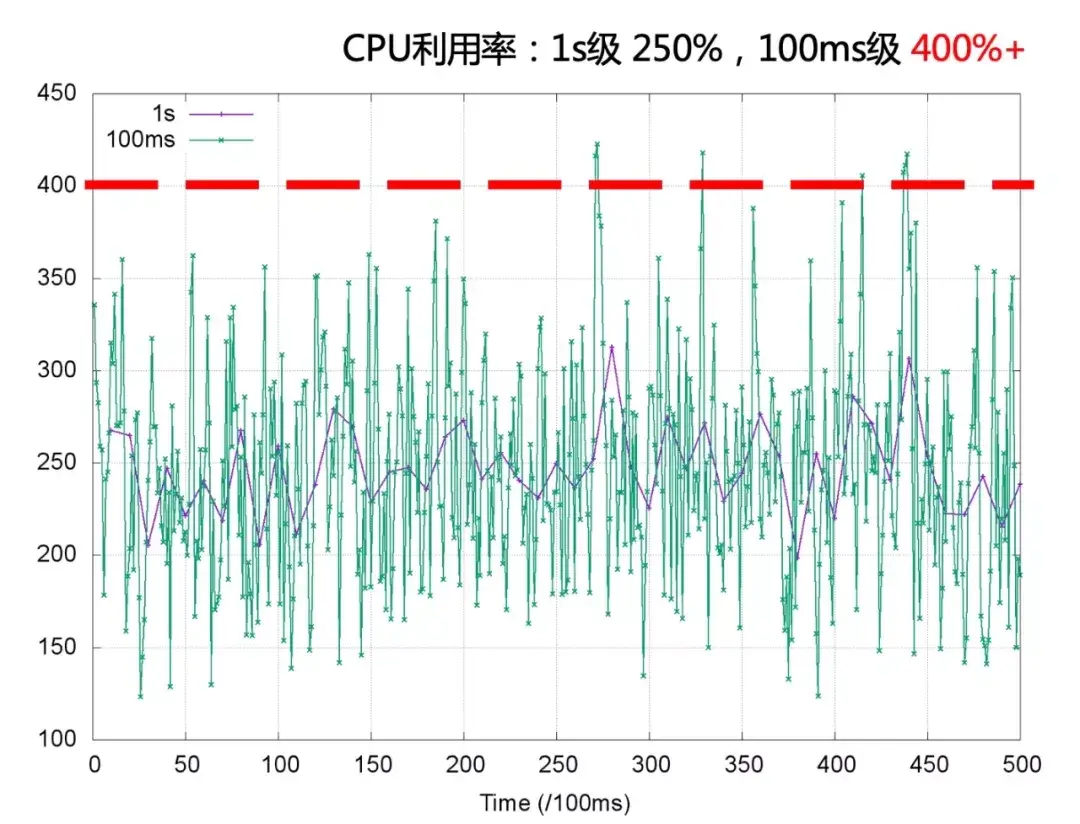
The utilization has already exceeded 400%.
In this case, you first need to upgrade the kernel version to 5.14 or above. The CPU Burst policy newly added in the 5.14 kernel can handle this kind of instantaneous CPU demand through a cumulative algorithm.
clamp_min(max(quantile_over_time(0.99, irate(container_cpu_usage_seconds_total{cluster="$cluster", namespace="$namespace", deployment="$deployment"}[2m])[1w:2m])) + quantile_over_time(0.99, (sum(irate(container_cpu_cfs_throttled_seconds_total{cluster="$cluster", name=~"^k8s_.*", namespace=~"$namespace", deployment=~"$deployment"}[10s])))[1w]), 0.52)
Limit = 99th percentile CPU cores used + 99th percentile CPU cores throttled, and no less than 0.52 cores.
If the kernel is not upgraded, the 99th percentile throttled CPU cores will be very high and need to be adjusted appropriately.
- Memory
When memory is exceeded, the kernel triggers an OOM, and you will find that the monitored memory value never exceeds the Limit. Therefore, the Limit should be set higher than the Request, but not so high as to trigger an OOM.
quantile_over_time(0.995, container_memory_working_set_bytes{cluster="$cluster", namespace="$namespace", deployment="$deployment"}[1w:5m])
You can start with the 99.5th percentile memory as the Limit and increase it gradually until OOM is no longer triggered.
4. Preparation Before Debugging
Having understood the business background and the related key points, before the actual configuration some preventive measures are still needed to avoid incidents.
4.1 Business SLO Alerts
Keeping a close eye on the business’s key SLIs is the key to being able to debug boldly; if the SLA cannot be guaranteed, all optimization is futile.
The metrics chosen here are the success rate and the backlog amounts A\B as the core indicators.
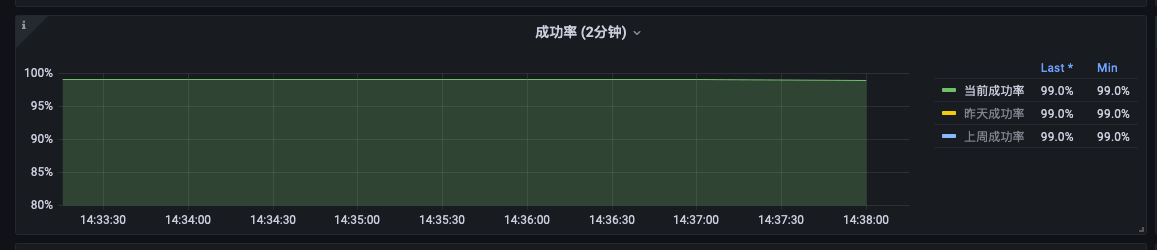
Success rate > 99%
This success rate requirement also affects the setting of many parameter percentiles.

Backlog A < 1000

Backlog B < 1000
It is recommended to use the metric that best reflects the consumer’s experience as the SLI, rather than defining the SLI from the perspective of R&D and operations.
4.2 Alerts Related to Cluster Application Pods
Since debugging HPA involves creating Pods, to avoid scaling failures the related Pod metrics need to be monitored.
- Pod not ready
sum by (cluster, app, pod)(kube_pod_status_ready{condition='false',exported_namespace='default'})
- Pod waiting for scheduling
sum by (cluster, app, pod)(kube_pod_status_phase{phase='Pending',exported_namespace='default'})
- Pod OOM
sum by (namespace,pod) ((kube_pod_container_status_restarts_total{exported_namespace="default"} - kube_pod_container_status_restarts_total{exported_namespace="default"} offset 10m >= 1) and ignoring (reason) min_over_time(kube_pod_container_status_last_terminated_reason{exported_namespace="default",reason='OOMKilled'}[10m]) == 1)
- Pod throttling
sum (rate (container_cpu_cfs_throttled_seconds_total{namespace="default",name=~"^k8s_.*"}[5m])) by (pod)
4.2 Application Tiering
Applications in production face tidal traffic, so resource usage always fluctuates. Once such fluctuation exceeds a node’s capacity, it causes the node to evict applications, affecting business stability.
And Kubernetes’ eviction policy is determined by the QoS type. There are three QoS types:
- BestEffort: no Request or Limit is set; when node resources are insufficient, these are evicted first
- Burstable: Request and Limit are not equal; when node resources are insufficient, these may be evicted
- Guaranteed: Request and Limit are equal; when node resources are insufficient, these are evicted as little as possible
You only need to distinguish two types: key business applications have Request and Limit equal, while non-key business applications have Request and Limit unequal.
4.3 Enabling Pod Scheduling Affinity
For applications with many replicas, ordinary applications can enable soft affinity to avoid being scheduled onto the same machine as much as possible.
| |
For applications with few replicas, key applications can enable hard affinity to force spreading across different machines.
| |
For applications with many replicas, it is best to use soft affinity, to avoid Cluster Autoscaler continuously scaling out and adding extra cost.
5. Starting to Configure HPA
5.1 Creating a New HPA Object
If you have an application example deployed as a Deployment, you only need to create an HPA object and specify the Deployment’s name.
Apply the following yaml object
| |
Or run the command
| |
Create the HPA object; its target is the example Deployment, with a maximum replica count of 5, a minimum replica count of 2, and a target CPU utilization of 60%. When the average CPU utilization of the Pods exceeds 60%, HPA increases the number of replicas.
5.2 HPA Parameters
Since I mainly use the HPA v1 CPU metric, I will only introduce a few of the main v1 parameters here.
- Lower bound on replica count
A production environment needs at least 2 Pods to avoid a single point of failure. Key applications need at least 3 Pods.
- Upper bound on replica count
The number of Pods will keep increasing as the load rises, so it is used on demand, which means the upper bound should be as large as possible. If there are usually 2-3 replicas, set the upper bound to 5. If the usual replica count is 10-20, set the upper bound to 30.
It is best to set the upper bound a bit higher than the usual amount, and preferably as a multiple of 5, so that it is easy to recognize that scaling has continued past the point where the number of added replicas reached the HPA upper bound.
- CPU utilization
The lower the CPU utilization is set, the more sensitive scaling is; the higher it is set, the lower the resource utilization. Usually it can be set to 50%-70% according to the application’s load.
The strategy for setting it is to set it to 50% first, and after it stabilizes, increase it gradually by 5%.
6. Summary
This post mainly records the problems and some thoughts I had after setting HPA for 60 applications. The main content is as follows:
- Request plays a very important role in cluster scheduling and HPA
- Setting an application’s Request and Limit through PromeQL
- Some alerts should be configured before debugging HPA, to guarantee the service’s SLA
- Configuring HPA and the related parameters
Setting Request, Limit, the HPA replica upper bound, the HPA replica lower bound, and the HPA CPU utilization for different applications is a tedious task; it is recommended to first build a Grafana calculation panel so you can calculate and debug in real time. Similar to the figure below:
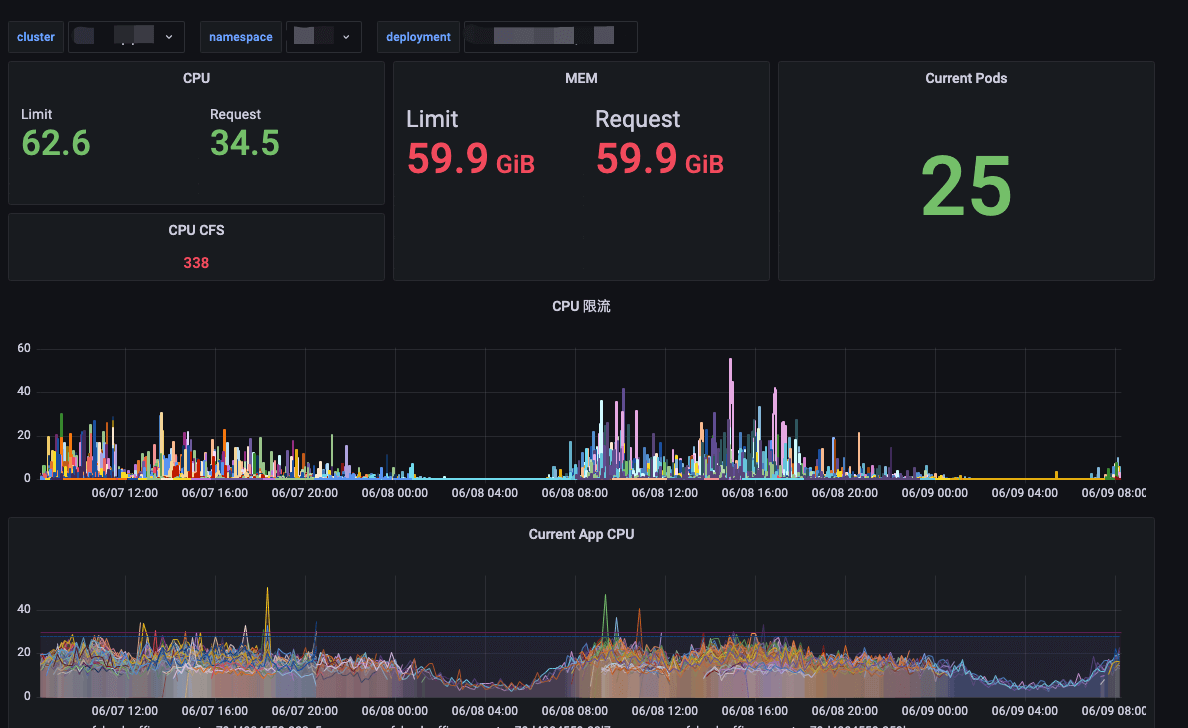
The final result is as follows:
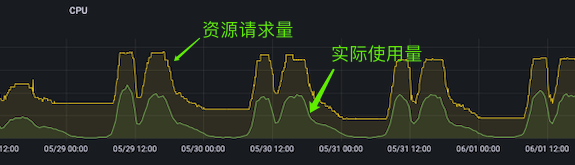
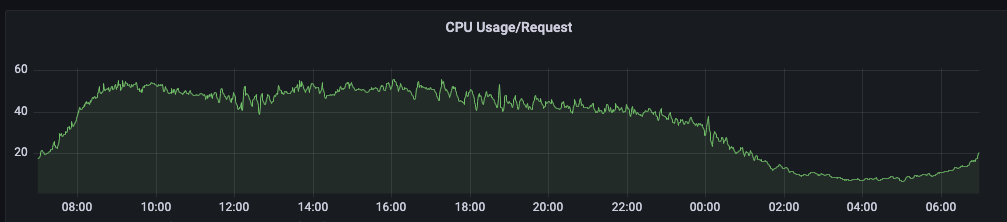
The requested amount of resources fluctuates with the usage, and the requested amount directly affects the number of public cloud machines used. The figure below shows the online Usage/Request situation, which is also the guiding metric for my continuous optimization of the HPA-related parameters.
Judging from the cloud vendor’s console bill, HPA reduced costs by 50% compared with no elasticity; in previous practice, CronHPA reduced costs by 30% compared with no elasticity.
Another thing to consider is migrating the elastic public cloud machines that are occupied long-term to the private cloud, or adopting an annual prepaid settlement method for the public cloud, because the cloud vendor’s on-demand elastic instances are relatively expensive.
