The monitoring metrics described in this article cover only the basic Kubernetes metrics, not business-related metrics. The components involved are prometheus-server, kube-state-metrics, and node-exporter, and the data retention period is 3 days.
1. Monitoring-related components in the cluster
| |
| |
2. How the metrics are calculated
- Total number of nodes in the cluster
count(kube_node_created{app_kubernetes_io_instance="prom-k8s"}) by (cluster)
- Cluster version
sum by (cluster,kubelet_version)(kube_node_info{app_kubernetes_io_instance="prom-k8s"})
- Number of running PODs
sum(kube_pod_info) by (cluster)
- Memory used by the monitoring components
sum(container_memory_working_set_bytes{image!="", namespace="monitor"}) by (cluster)
- CPU used by the monitoring components
sum (rate (container_cpu_usage_seconds_total{namespace="monitor"}[5m])) by (cluster)
3. Analysis of the statistical data
| Node count | Kubernetes version | POD count | Memory used by monitoring | CPU used by monitoring |
|---|---|---|---|---|
| 19 | v1.16.8 | 1046 | 7.04 GB | 0.289 |
| 22 | v1.19.15 | 1014 | 4.56 GB | 0.239 |
| 28 | v1.18.20 | 974 | 3.23 GB | 0.187 |
| 12 | v1.16.11 | 600 | 2.94 GB | 0.134 |
| 8 | v1.20.12 | 195 | 2.48 GB | 0.598 |
| 9 | v1.16.9 | 616 | 2.11 GB | 0.116 |
| 13 | v1.16.11 | 558 | 1.87 GB | 0.096 |
| 20 | v1.16.11 | 452 | 1.78 GB | 0.099 |
| 14 | v1.16.11 | 378 | 1.57 GB | 0.064 |
| 9 | v1.19.15 | 284 | 1.52 GB | 0.090 |
| 6 | v1.16.11 | 428 | 1.48 GB | 0.102 |
| 12 | v1.16.8 | 324 | 1.36 GB | 0.052 |
| 9 | v1.16.11 | 382 | 1.09 GB | 0.065 |
| 4 | v1.20.12 | 220 | 1.08 GB | 0.052 |
| 12 | v1.16.11 | 504 | 1.04 GB | 0.060 |
| 4 | v1.20.12 | 156 | 1.01 GB | 0.042 |
| 4 | v1.16.11 | 170 | 937.66 MB | 0.055 |
| 8 | v1.16.11 | 254 | 914.81 MB | 0.053 |
| 10 | v1.16.8 | 435 | 907.60 MB | 0.032 |
| 10 | v1.16.11 | 278 | 852.69 MB | 0.034 |
| 11 | v1.16.11 | 420 | 839.70 MB | 0.047 |
| 7 | v1.16.11 | 268 | 815.48 MB | 0.046 |
| 4 | v1.16.11 | 248 | 804.21 MB | 0.032 |
| 9 | v1.16.11 | 256 | 784.44 MB | 0.034 |
| 10 | v1.16.11 | 284 | 776.07 MB | 0.047 |
| 6 | v1.16.11 | 222 | 745.46 MB | 0.034 |
| 8 | v1.16.11 | 252 | 709.10 MB | 0.034 |
| 5 | v1.16.11 | 200 | 678.32 MB | 0.036 |
| 7 | v1.16.11 | 202 | 642.48 MB | 0.037 |
| 5 | v1.16.8 | 174 | 640.41 MB | 0.030 |
| 7 | v1.20.12 | 97 | 624.49 MB | 0.025 |
| 6 | v1.16.11 | 198 | 590.52 MB | 0.029 |
| 6 | v1.20.12 | 95 | 578.39 MB | 0.034 |
| 7 | v1.16.11 | 222 | 569.38 MB | 0.032 |
| 6 | v1.16.11 | 140 | 560.03 MB | 0.027 |
| 8 | v1.16.11 | 166 | 557.45 MB | 0.028 |
| 5 | v1.20.12 | 70 | 494.62 MB | 0.019 |
| 5 | v1.16.11 | 120 | 455.13 MB | 0.024 |
| 6 | v1.16.8 | 112 | 449.50 MB | 0.022 |
| 7 | v1.16.11 | 128 | 448.15 MB | 0.026 |
| 6 | v1.16.11 | 112 | 441.64 MB | 0.022 |
| 6 | v1.16.11 | 112 | 437.66 MB | 0.026 |
| 2 | v1.16.11 | 84 | 326.72 MB | 0.024 |
| 2 | v1.20.15 | 11 | 208.16 MB | 0.012 |
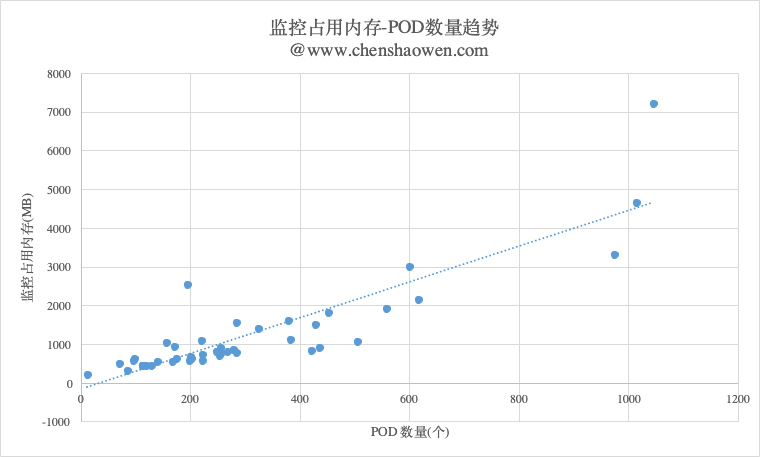
The average POD count per cluster is 306, the average memory usage is 1246 MB, and a single POD consumes roughly 40 MB of memory. CPU consumption can basically be ignored.
