1. Install node exporter
| |
If you cannot reach GitHub, refer to: Several ways to access GitHub from mainland China .
2. Configure and start the exporter
- Add a Systemd configuration
| |
Add the following content:
| |
- Start the exporter
| |
- Enable it at boot
| |
- Check the metrics endpoint locally
| |
3. Prometheus configuration
- Add a job
Since Prometheus is deployed on Kubernetes, we edit the ConfigMap directly here:
| |
Under the scrape_configs field, add the following content:
| |
- Check the targets
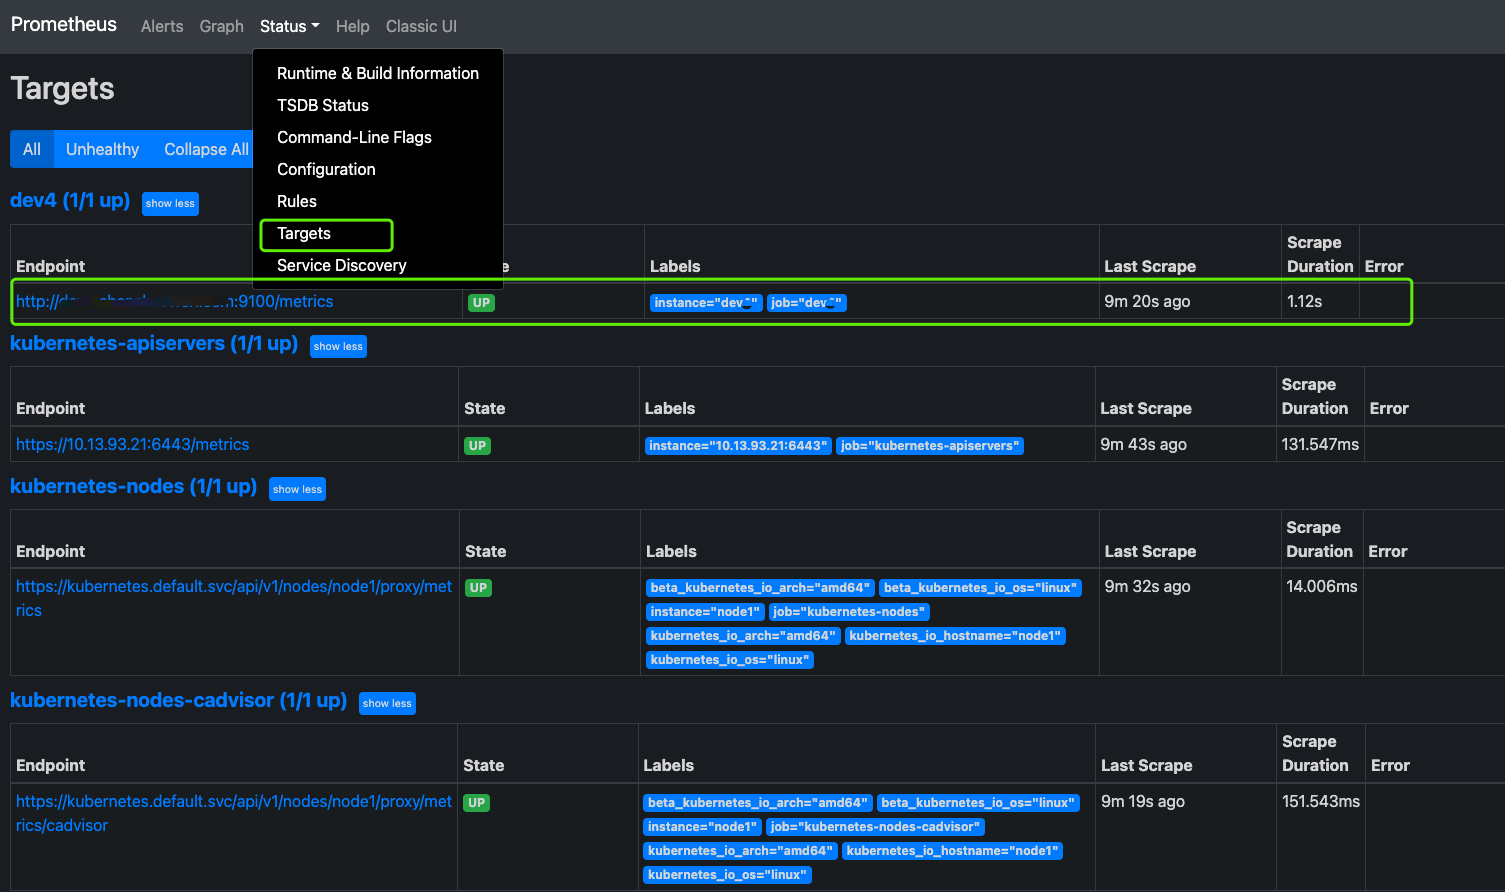
At this point the endpoint’s status is Up, which means data is being reported successfully.
4. Grafana configuration
Here you first need to add a Prometheus data source, then import the Grafana dashboard, and you can see the panels. Reference: Building Kubernetes monitoring with Prometheus and Grafana .
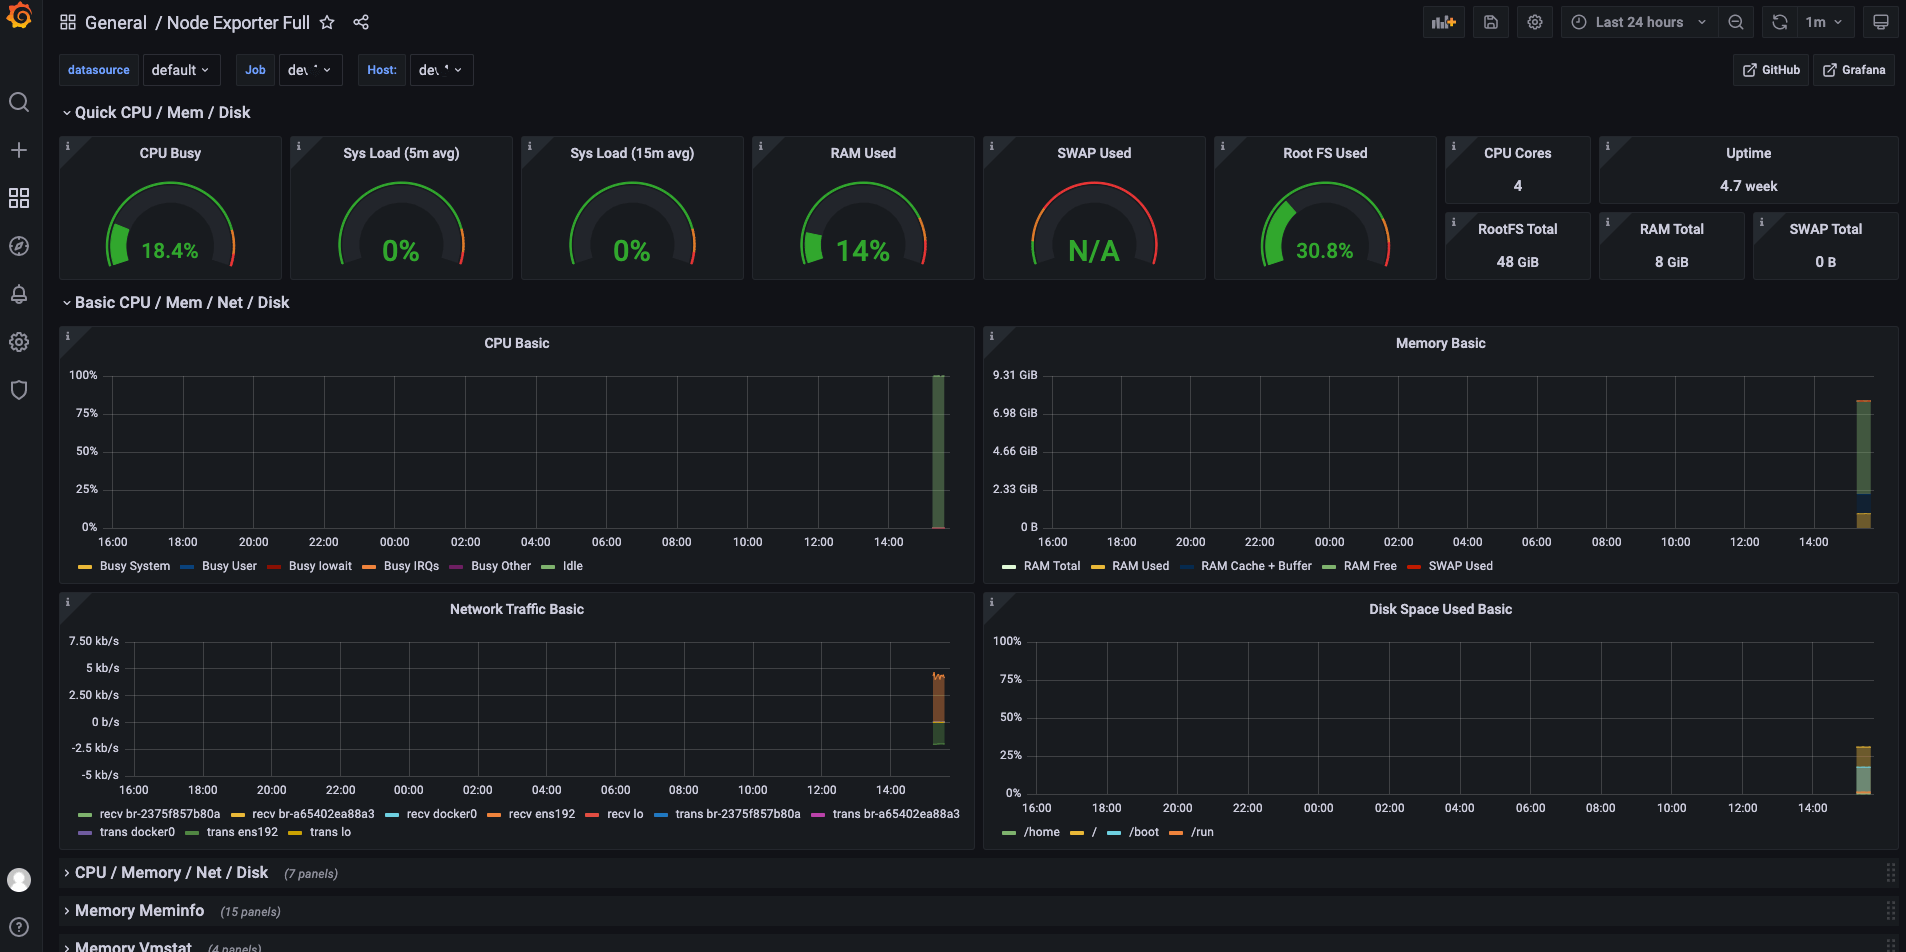
Many people use 8919 for host monitoring, but I find the dashboard a bit complex; here I use 1860. The result is shown below: