1. Symptoms
Elasticsearch on Kubernetes was restarting frequently, leaving the service almost unusable.
- During data import, the Pod’s memory usage kept growing
- Once the Pod’s memory usage approached the Limit, continued importing triggered an abnormal Pod exit, with the error log
ERROR: Elasticsearch exited unexpectedly - The Pod’s memory usage did not drop; it stayed near the Limit, and before long the Pod exited abnormally again
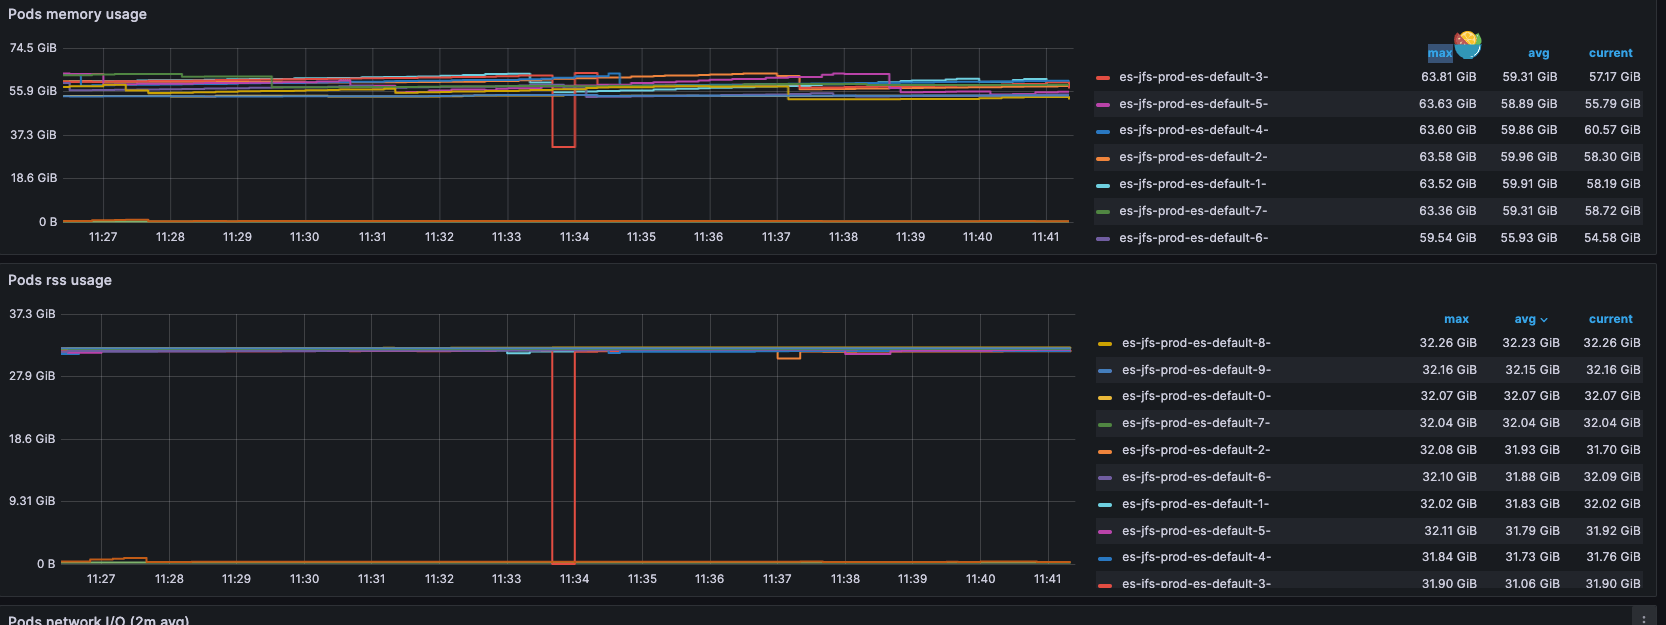
The Elasticsearch Pod’s memory limit was 64GB, while the JVM memory limit was 32GB.
2. Inspecting the Runtime Environment
Because the Elasticsearch Pod frequently entered Crash and OOMkilled states, I ran an inspection of the runtime environment.
- Cluster and kernel versions
| |
The kernel version and cluster version are both quite high.
- Checking node load
| |
Every node’s CPU and memory utilization was very low, none exceeding 50%. Each node was equipped with 176 CPU cores and 2.0TB of memory.
- Node memory usage
| |
The large amount of Cache usage caught my attention.
3. Cause
The metric that triggers container Memory OOM is container_memory_working_set_bytes, whose actual composition is RSS + Cache.
RSS is the amount of space the process currently occupies in physical memory, including code, data, and stack.
Cache is the portion of memory the operating system uses to cache recently accessed file data. This data is usually file contents read from disk, cached in physical memory; when the system’s Cache is high, it means a large amount of memory is being used to cache recently accessed file data — that is, the Cache pressure brought by a large number of IO operations.
From the monitoring above you can see that Elasticsearch’s RSS usage stayed at 32GB the whole time, so only the Cache could be growing.
Next, I ran Elasticsearch without setting a Limit and observed the Pod’s memory usage.
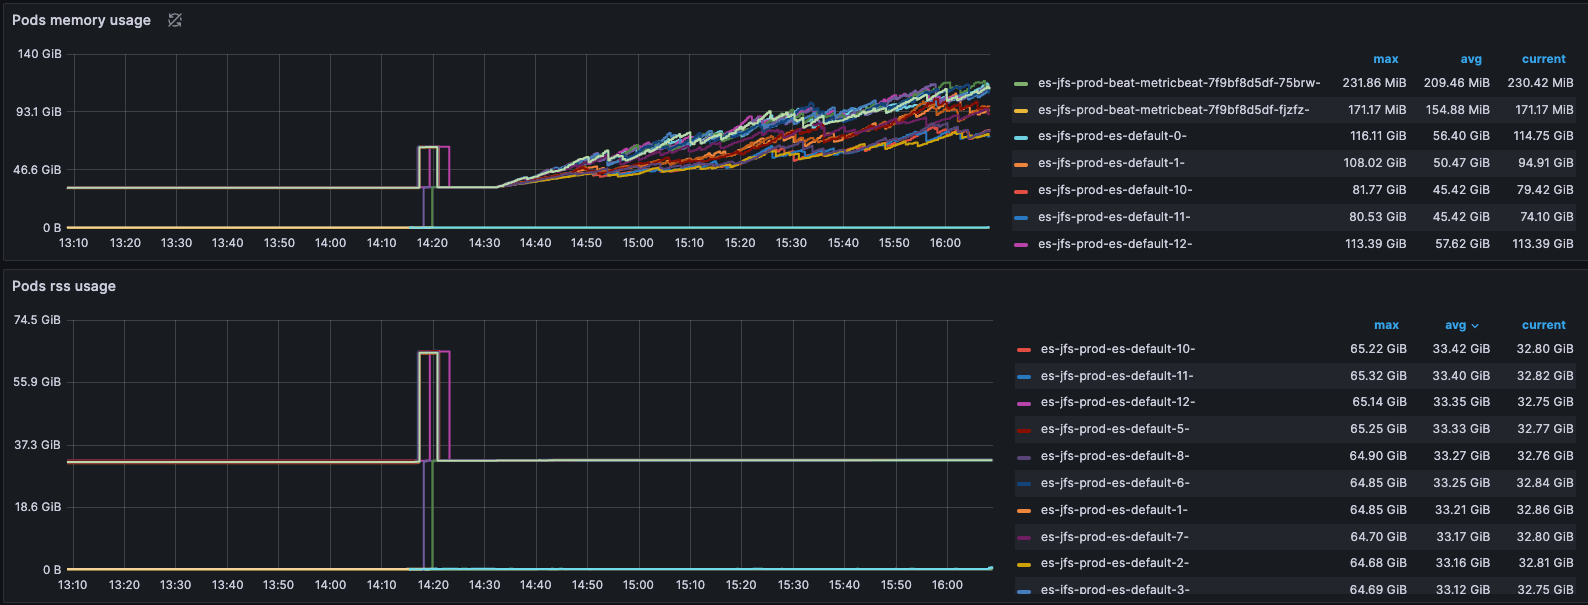
As shown above, with data being imported continuously, the Pod’s Page Cache usage kept growing.
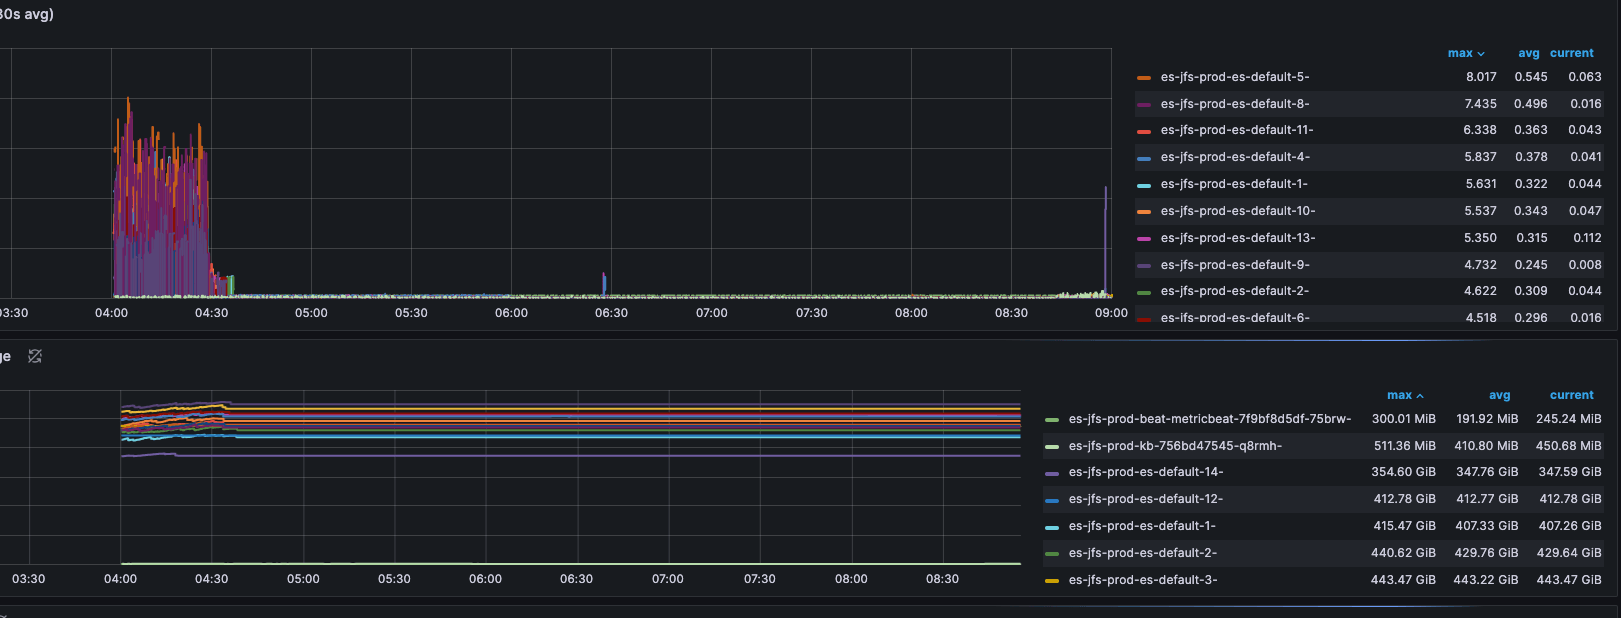
As shown above, only after the data import stopped did Page Cache usage stop growing — but it was not released immediately either.
4. Solutions
Clearing the Cache is one solution. But there is no way to clear the Cache per application; clearing all Cache on the host affects other applications. At the same time, from the free output above, you can see the Cache was too large, so running sync && echo 3 > /proc/sys/vm/drop_caches would require a very long wait.
Another reason not to clear the Cache directly is that the cluster was running training jobs; if a training job used the same dataset, clearing the Cache would invalidate the cache and increase training time.
Restarting the application was the only option:
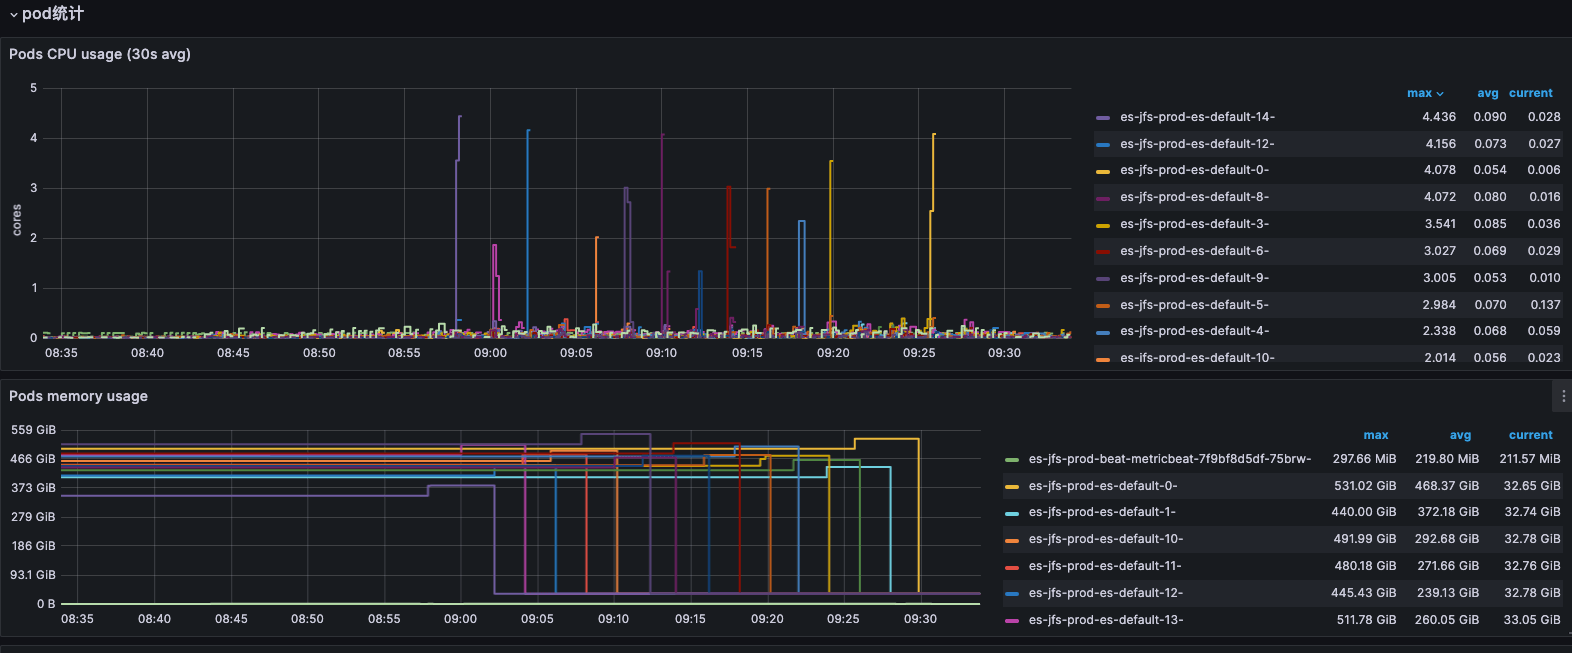
The image above shows the memory usage monitoring after restarting the application; the Cache was released.
What needs attention here is how to restart the application. There are three ways:
- Delete Pod
- Restart StatefulSet
- ECK Operator Restart
Here I recommend modifying ECK’s Request configuration value to trigger an application restart; the other ways easily cause the new Pod to be recognized as a new Elasticsearch Node, triggering index rebuilding. Exactly what triggers that and what allows direct reuse, I still cannot be certain.
