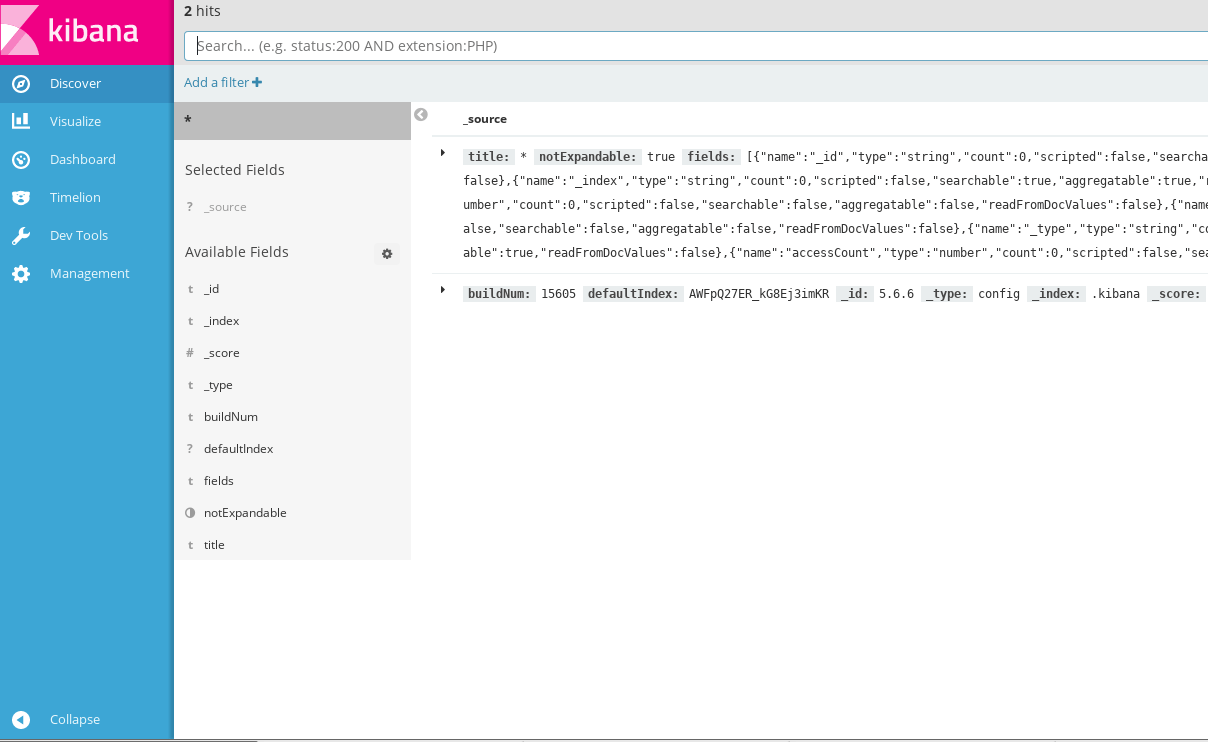
This article gives a brief introduction to the ELK stack and provides a Docker compose orchestration configuration. After reading it, you can get ELK running locally with Docker. A later article will cover deploying ELK on servers and adding the related configuration.
1. Introduction to the ELK Stack
ELK is not actually a single piece of software but a whole solution — an acronym formed from the initials of three software products: Elasticsearch, Logstash, and Kibana. All three are open-source, are usually used together, and are collectively called the ELK stack.
ELK has become the most popular centralized logging solution today.
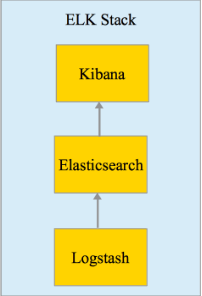
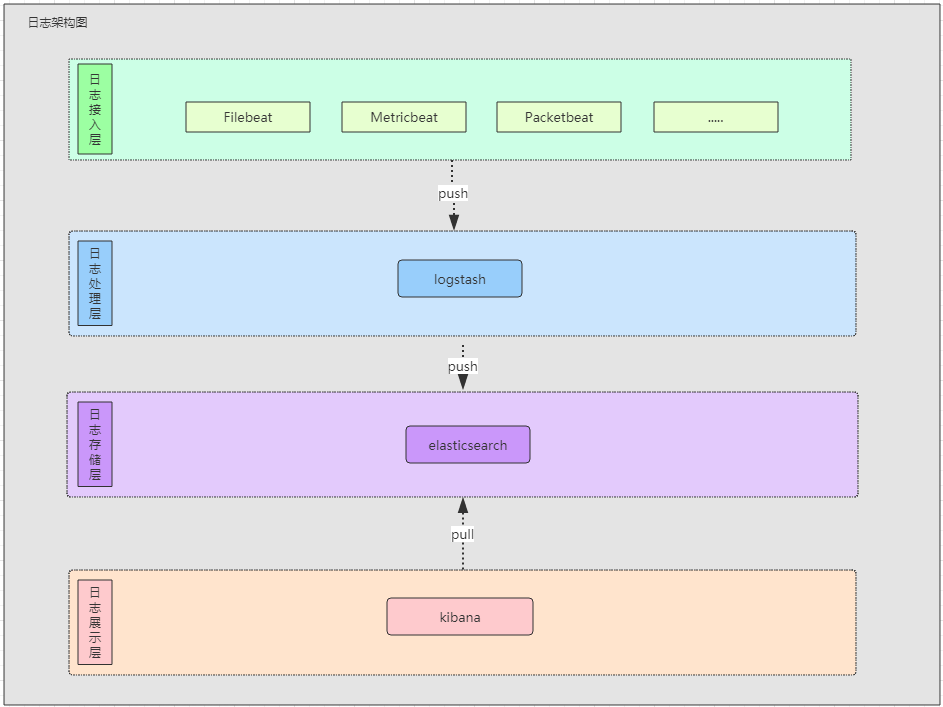
The basic flow is: Logstash collects data from various data sources and sends it to Elasticsearch; Elasticsearch creates indexes for that data; Kibana then analyzes it in various ways and displays the results as charts.
Logstash consumes too many system resources on a server, so Beats is usually introduced as the log collector. The CPU and memory Beats uses on a system is almost negligible.
2. Elasticsearch
Elasticsearch is a real-time distributed search and analytics engine. It can be used for full-text search, structured search, and analytics. It is a search engine built on top of the full-text search engine Apache Lucene and is written in Java.
Main features
- Real-time analytics
- Distributed real-time file storage, with every field indexed
- Document-oriented: every object is a document
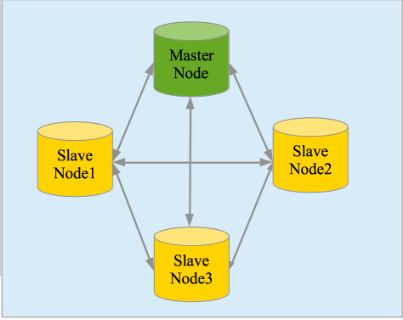
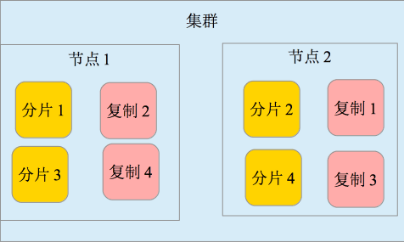
- High availability, easy to scale, with cluster, shard, and replica support (Shards and Replicas)
- Friendly interface, with JSON support
3. Logstash
Logstash is a data collection engine with real-time pipeline capabilities, written in JRuby. Its author is the world-famous operations engineer Jordan Sissel.
Main features
- Can access almost any kind of data
- Can be combined with many external applications
- Supports elastic scaling
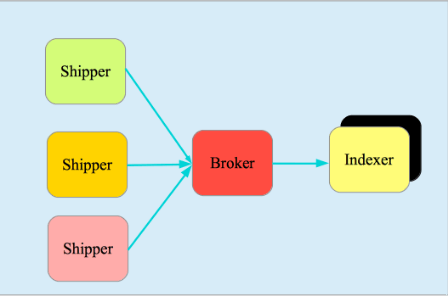
It consists of three main parts:
- Shipper — sends log data
- Broker — collects data, with Redis built in by default
- Indexer — writes data
4. Kibana
Kibana is an open-source analytics and visualization platform designed to be used together with Elasticsearch. Kibana lets you search, view, and interact with the data stored in Elasticsearch indexes, and makes advanced data analytics and data visualization easy.
Kibana can handle massive volumes of data well and, based on it, create bar charts, line charts, scatter plots, histograms, pie charts, and maps.
5. Filebeat
Filebeat is derived from the source of logstash-forwarder — in other words, Filebeat is the newest version of logstash-forwarder. It is responsible for fetching logs from the current server and forwarding them to Logstash or Elasticsearch for processing.
Filebeat consists of two parts: prospectors and harvesters. Harvesters are responsible for collecting logs from files; prospectors are responsible for managing the harvesters.
6. Practice
docker-compose.yml
| |
Taking CentOS as an example, you first need to install Docker and Docker compose.
| |
Start Docker.
| |
Locally, you can visit the Kibana page at http://127.0.0.1:5601.