1. Introduction
Graphviz is an open-source drawing toolkit developed at Bell Labs. It uses a specific DSL (domain-specific language), DOT, as its scripting language. It uses layout engines to parse DOT scripts and complete automatic layout. It supports a rich set of export formats, such as PNG, JPG, PostScript, SVG, PDF, and more.
Supported layout engines:
- dot — the default layout, mainly for directed graphs
- neato — layout based on the spring-model (also called force-based) algorithm
- twopi — radial layout
- circo — circular layout
- fdp — undirected graph layout
The compile command is:
| |
Graphviz has several cmd commands, all used in exactly the same way; the only difference is the rendered image. The cmd choices are [dot, neato, twopi, circo, fdp] — the layout engines above.
Compile with the dot command, for example
| |
2. DOT Syntax Features
DOT syntax is fairly simple: there are no special formatting requirements, and no complex operators or structures. A Graphviz graph consists mainly of nodes, edges, and labels.
2.1 Syntax Keywords
- Comments — use // for comments
- Directed graph — use digraph to define a directed graph
- Directed graph — use -> to express the relationship between nodes
- Undirected graph — use graph to define an undirected graph
- Undirected graph — use – to express the relationship between nodes
- Relationship between nodes — directed graph: a -> b, node a points to node b
- Relationship between nodes — undirected graph: a – b, node a is connected to node b
- Defining node attributes — format: node[attribute1=value1, attribute2=value2]
- Subgraph — use subgraph to define a subgraph
2.2 Common Attributes
| Attribute name | Default value | Meaning |
|---|---|---|
| color | black | Color |
| colorscheme | X11 | Color description |
| fontcolor | black | Text color |
| fontname | Times-Roman | Font |
| fontsize | 14 | Text size |
| label | Displayed label; for a node it defaults to the node name | |
| penwidth | 1.0 | Line width |
| style | Style | |
| weight | Importance |
2.3 Graph Attributes
| Attribute name | Default value | Meaning |
|---|---|---|
| bgcolor | Background color | |
| concentrate | false | Let multiple edges share a common part |
| nodesep | .25 | Spacing between nodes (inches) |
| peripheries | 1 | Number of boundaries |
| rank | same,min,source,max,sink; sets the order of multiple nodes | |
| rankdir | TB | Rank direction |
| ranksep | .75 | Spacing |
| size | Size of the graph (inches) |
2.4 Node Attributes
| Attribute name | Default value | Meaning |
|---|---|---|
| shape | ellipse | Shape |
| sides | 4 | Number of sides when shape=polygon |
| fillcolor | lightgrey/black | Fill color |
| fixedsize | false | Whether the label affects the node’s size |
2.5 Edge Attributes
| Attribute name | Default value | Meaning |
|---|---|---|
| arrowhead | normal | Shape of the arrow head |
| arrowsize | 1.0 | Arrow size |
| arrowtail | normal | Shape of the arrow tail |
| constraint | true | Whether the edge affects node ranking |
| decorate | When set, a line is drawn connecting the edge and its label | |
| dir | forward | Sets direction: forward,back,both,none |
| headclip | true | Whether to stop at the boundary |
| tailclip | true | Similar to headclip |
3. Examples
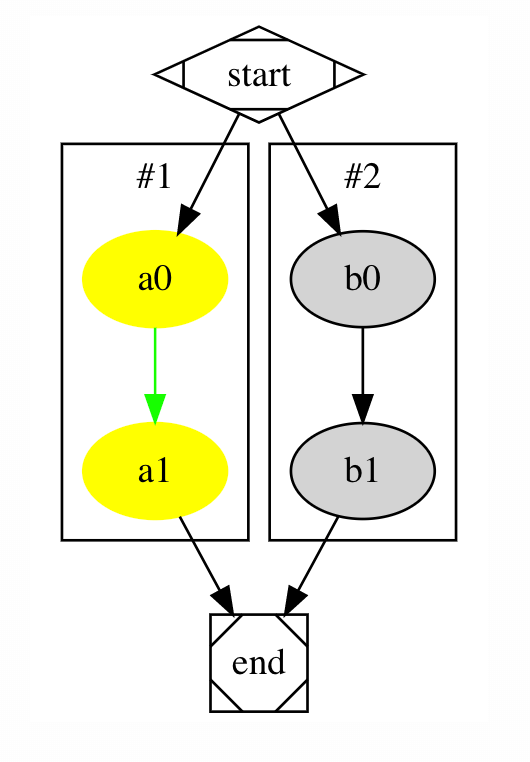
3.1 Flowchart
- Source code
digraph G {
	subgraph cluster_0 {
		node [style=filled,color=yellow]; //设置节点属性
                edge [color = "green", decorate = false]; //设置边属性
		a0 -> a1;//连接信息
		label = "#1";//标签
	}
	subgraph cluster_1 {
		node [style=filled];
		b0 -> b1;
		label = "#2";
	}
	start -> {a0,b0};
	{a1,b1} -> end;
	start [shape=Mdiamond];//设置节点图形
	end [shape=Msquare];
}
- Generated graph
3.2 Structure Diagram
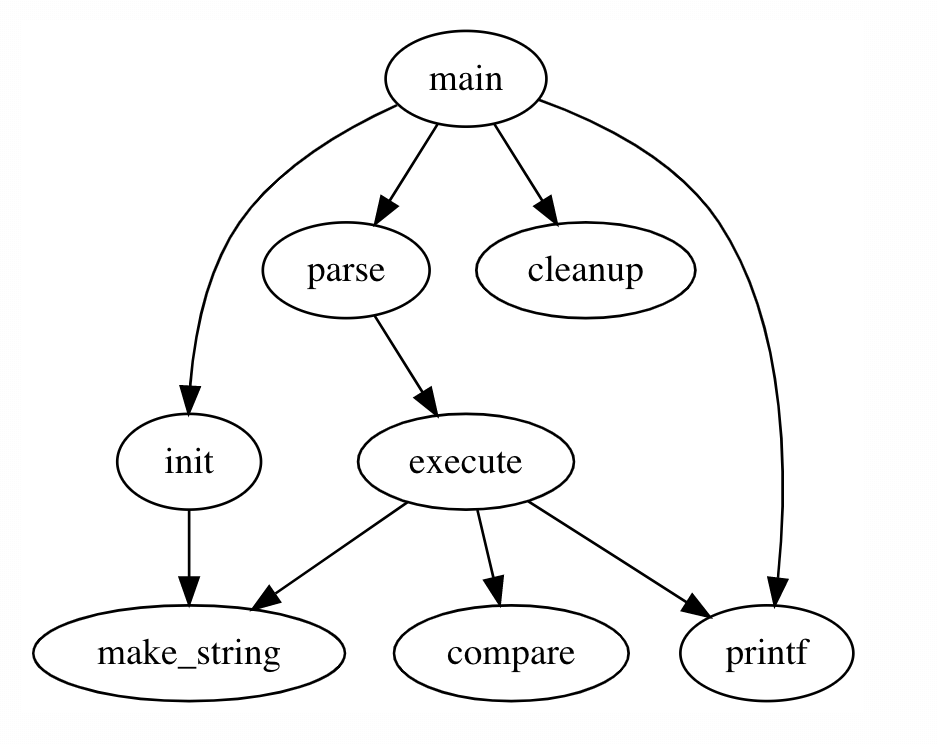
- Source code
digraph G {
    main -> parse -> execute;
    main -> init;
    main -> cleanup;
    execute -> make_string;
    execute -> printf;
    init -> make_string;
    main -> printf;
    execute -> compare;
}
- Generated graph
3.3 Data Structure Diagram
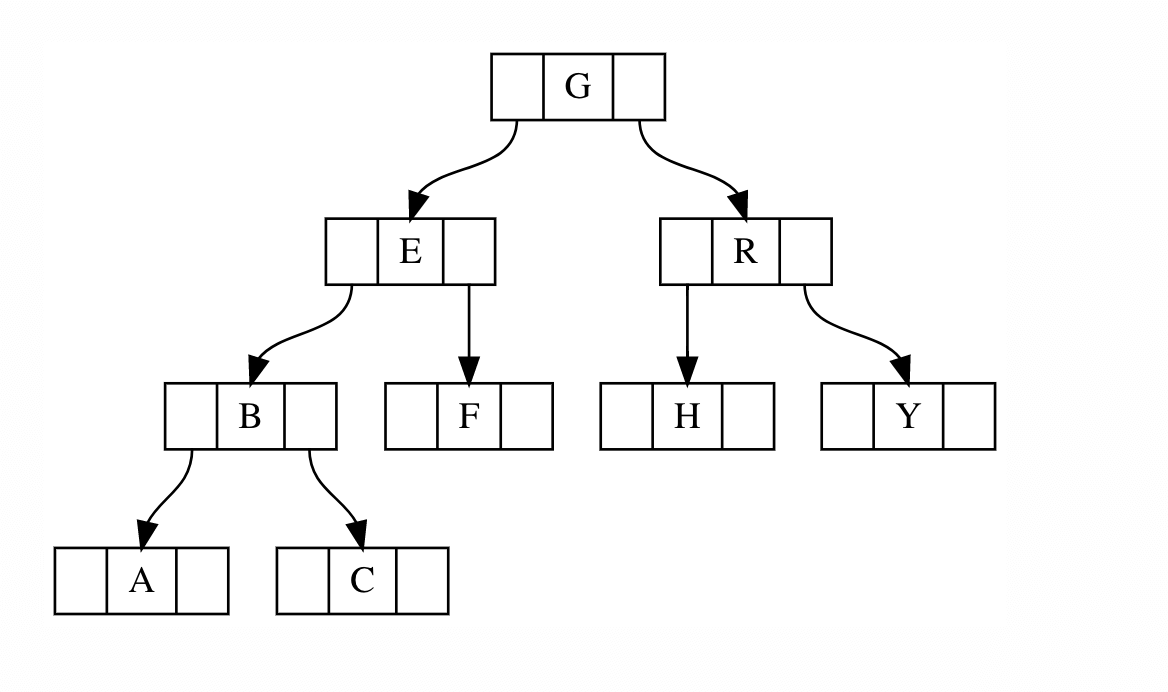
- Source code
digraph g {
    node [shape = record,height=.1];
    node0[label = "<f0> |<f1> G|<f2> "];
    node1[label = "<f0> |<f1> E|<f2> "];
    node2[label = "<f0> |<f1> B|<f2> "];
    node3[label = "<f0> |<f1> F|<f2> "];
    node4[label = "<f0> |<f1> R|<f2> "];
    node5[label = "<f0> |<f1> H|<f2> "];
    node6[label = "<f0> |<f1> Y|<f2> "];
    node7[label = "<f0> |<f1> A|<f2> "];
    node8[label = "<f0> |<f1> C|<f2> "];
    "node0":f2 -> "node4":f1;
    "node0":f0 -> "node1":f1;
    "node1":f0 -> "node2":f1;
    "node1":f2 -> "node3":f1;
    "node2":f2 -> "node8":f1;
    "node2":f0 -> "node7":f1;
    "node4":f2 -> "node6":f1;
    "node4":f0 -> "node5":f1;
}
- Generated graph
4. Frontend Integration
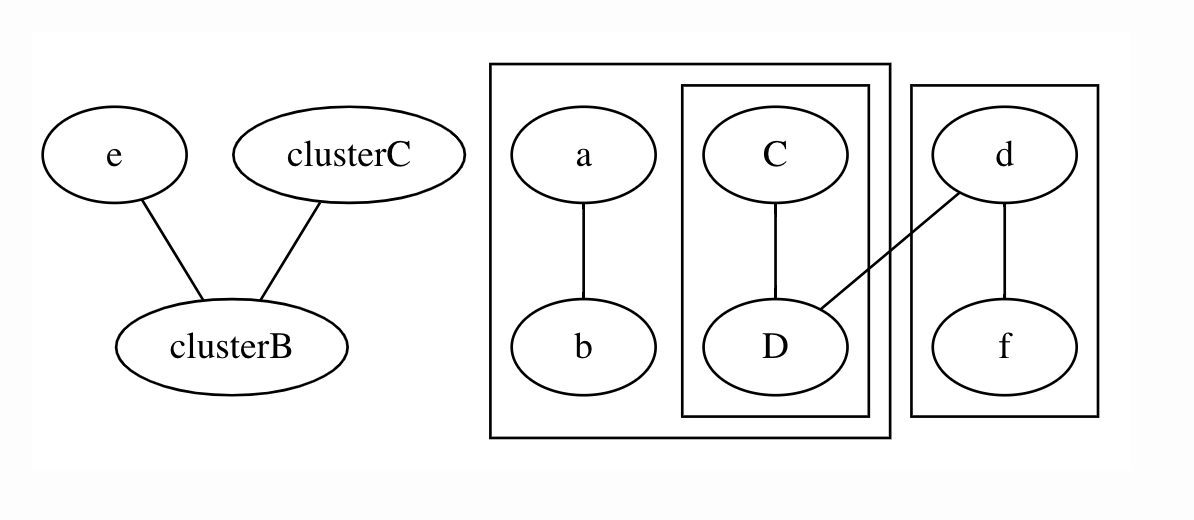
Integrating Graphviz in the frontend is done mainly through Viz.js: it converts text content into an image, which is then dynamically added to the page. Here is a piece of JavaScript that gets the text content of a tag and inserts the image generated by Viz.js as a sibling of that tag.
- Add the conversion script
| |
- Insert a DOT script using a gcode tag
| |
- Generated image content
5. References
- 1.http://www.graphviz.org/Download.php
- 2.https://zh.wikipedia.org/zh-hans/Graphviz
- 3.https://github.com/mdaines/viz.js/
- 4.http://viz-js.com/
