As the data volume exploded, the system responded very slowly. We carried out a series of optimizations on the application, and the system’s response time improved by an order of magnitude. Overall, optimizations in file compression and faster network access gave a noticeable boost to frontend performance, while optimizations in stored procedures, caching, and logic code gave a noticeable boost to backend performance. This article collects the optimization ideas and methods.
1. Mapping the Chain
Before optimizing, mapping the entire chain is especially important.
Optimization is a systems-engineering effort; you cannot get great results from a simple add or remove. Nor did we deliberately design the system to be slow — rather, the preconditions under which the system was designed have changed, and the whole system needs to be re-examined. Optimization is about finding those changes and letting the system adapt to them.
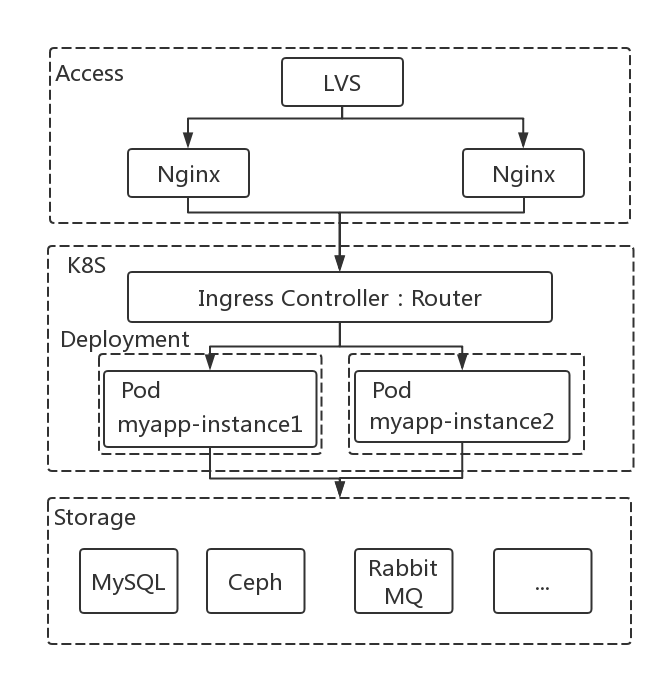
The figure below lays out the whole system chain: an access layer, a logic layer, and a storage layer.
2. Project Background and Optimization Approach
This is a Web application combining a store and a community forum, with a mini-program client as well. It has to support not only product publishing, updates, transactions, and day-to-day operations, but also social features such as community Q&A, follows, and likes. For certain historical reasons, the system has as many as 142 database tables.
In one phrase: big and messy. At the same time, there was only one frontend developer and one backend developer.
The project was developed with a frontend/backend separation model, and the optimization followed the same idea. Frontend and backend are handled separately: first use some analysis tools to find the time-consuming nodes along the chain, then optimize.
Below are some optimization measures already taken or about to be taken.
3. Frontend
3.1 Optimizing Based on PageSpeed Insights Analysis
PageSpeed Insights is a website analysis and optimization tool developed by Google. There is a web version and a Google Chrome extension version.
After installing the extension, open the developer tools with F12 and click [ANALYZE]. You will see PageSpeed’s score and suggested changes for the page.
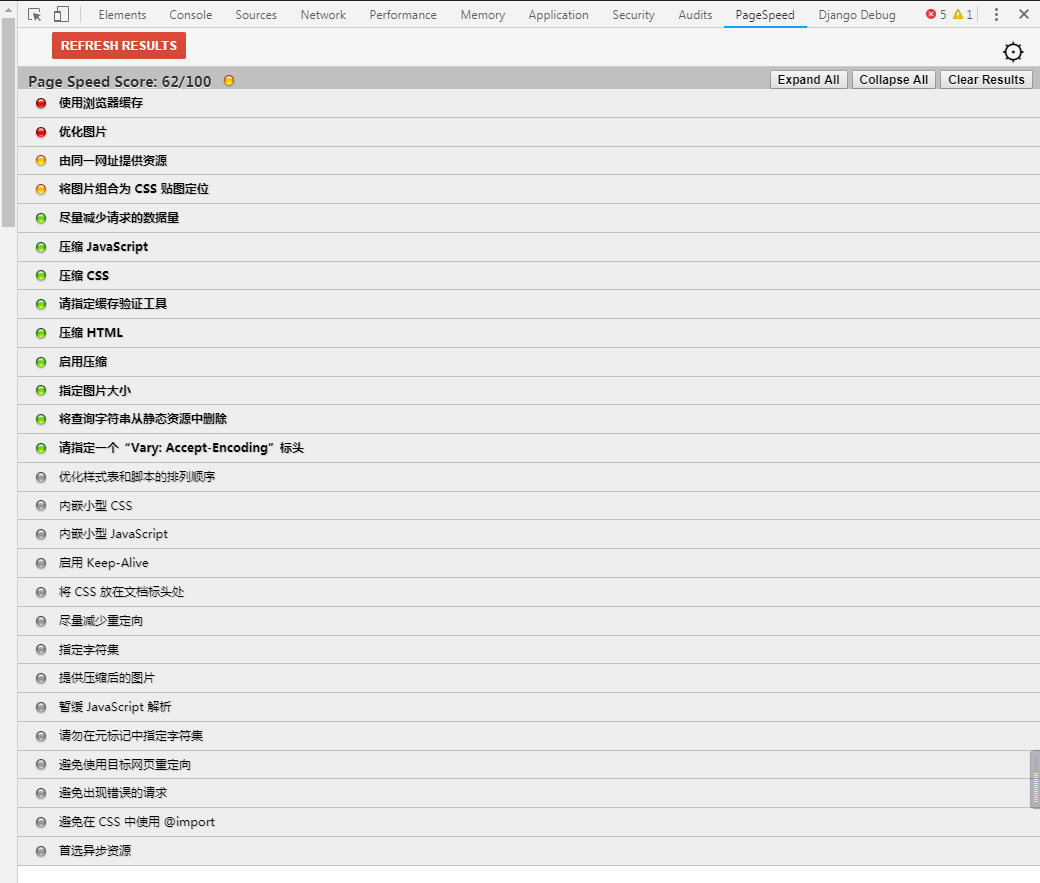
Clicking each suggestion shows more detail. PageSpeed Insight’s analysis covers the following areas:
- Optimize caching — keep your app’s data and logic entirely off the network
- Reduce response time — reduce the number of request-response round trips
- Reduce request size — reduce upload size
- Reduce payload size — reduce response, download, and cached page sizes
- Optimize browser rendering — improve the browser’s page layout
3.2 Hosting Static Files on a CDN
The main advantages of CDN technology:
Faster access
Users connect to the nearest CDN server to get content, which gives a noticeable speedup.Availability
Under high-stress conditions such as excessive user traffic, intermittent peaks, and potential server failures, the CDN still ensures users can get the content.Security
CDN services can effectively mitigate various attack behaviors.
Hosting frontend static files on a CDN is a very important part of frontend optimization. Of course, this kind of change requires support from the deployment system.
3.3 Splitting Frontend Static Files by Page
Splitting the frontend’s bundled static files lets users load on demand when they visit the app, rather than requesting every file on the first page load. The frontend uses webpack 3.6.0; just add the following to the plugins property of webpackConfig:
| |
3.4 Reducing Unnecessary API Calls
Because frontend developers changed frequently and handovers were common, the implementation logic was inconsistent. At the same time, frontend code quality varied, and the implementation was hard to extend and maintain. The following situations mainly exist:
- An interface already called in a common module is called again in a routed sub-page
- An interface that belongs to only one routed sub-page is called by every page
- The same interface is called multiple times on a page
This part mainly requires frontend developers to review the code and optimize at the code-logic level.
4. Backend
This section is divided into two parts. The first introduces several performance analysis tools; building on that analyzed data, the second half focuses on how to optimize.
4.1 Analyzing Time Consumption with django-debug-toolbar
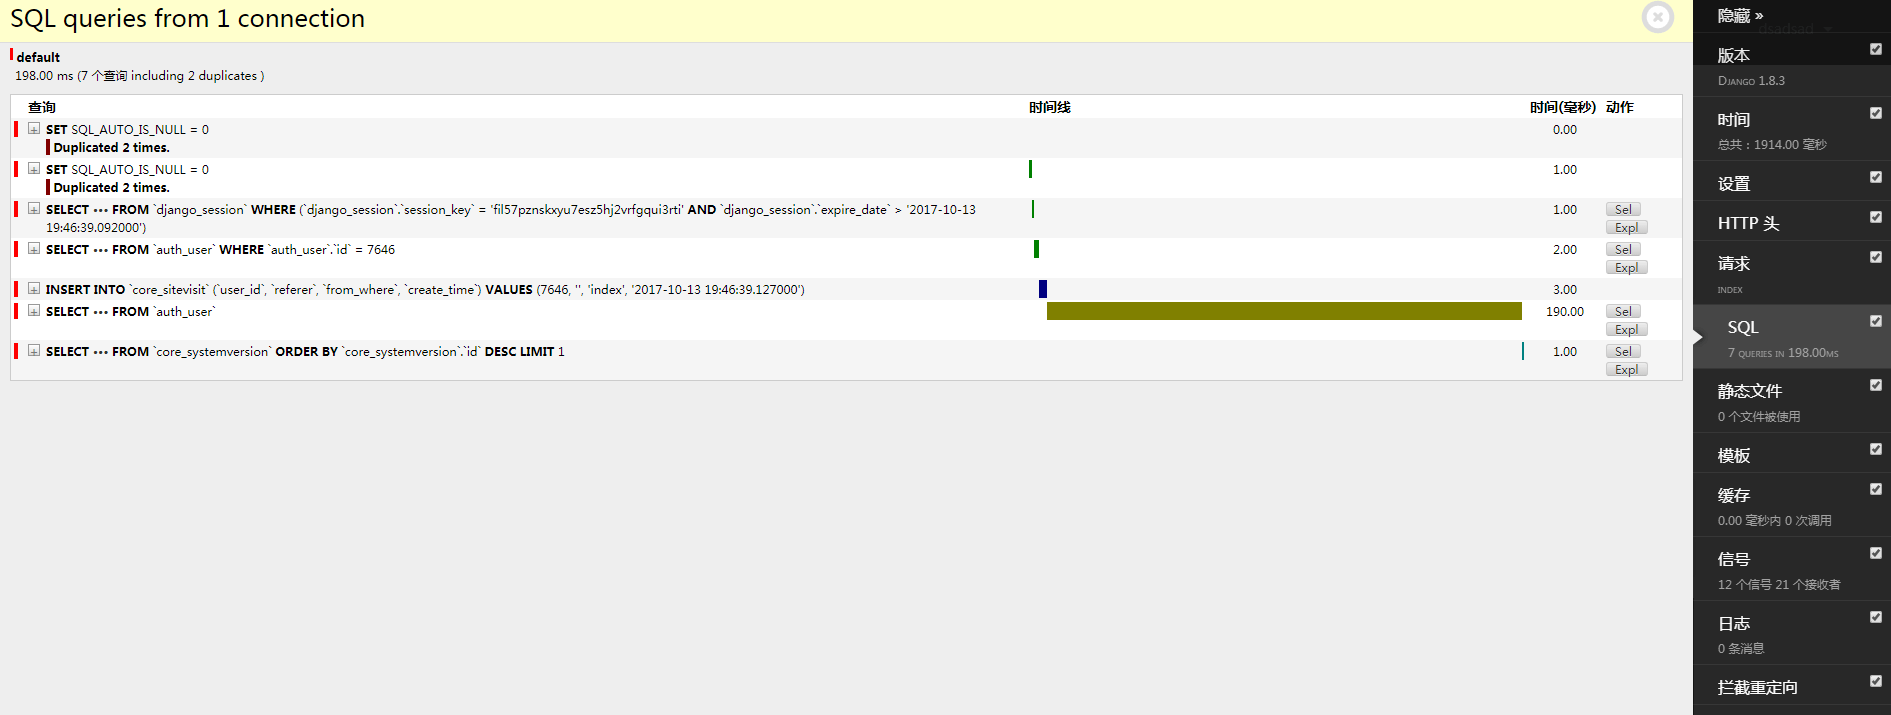
django-debug-toolbar is a good Django performance inspection tool. It mainly provides performance checks in the following areas:
- How many SQL statements were executed
- How much time was spent on the database
- What special query operations ran, and how long each query took
- Which code generated those queries
- Which templates were used to render the page
- How cold/hot caching affects performance
- Install
| |
- Configure
| |
url.py
| |
Once configured successfully, you can see the related performance inspection data:
4.2 Analyzing Ajax with django-debug-panel
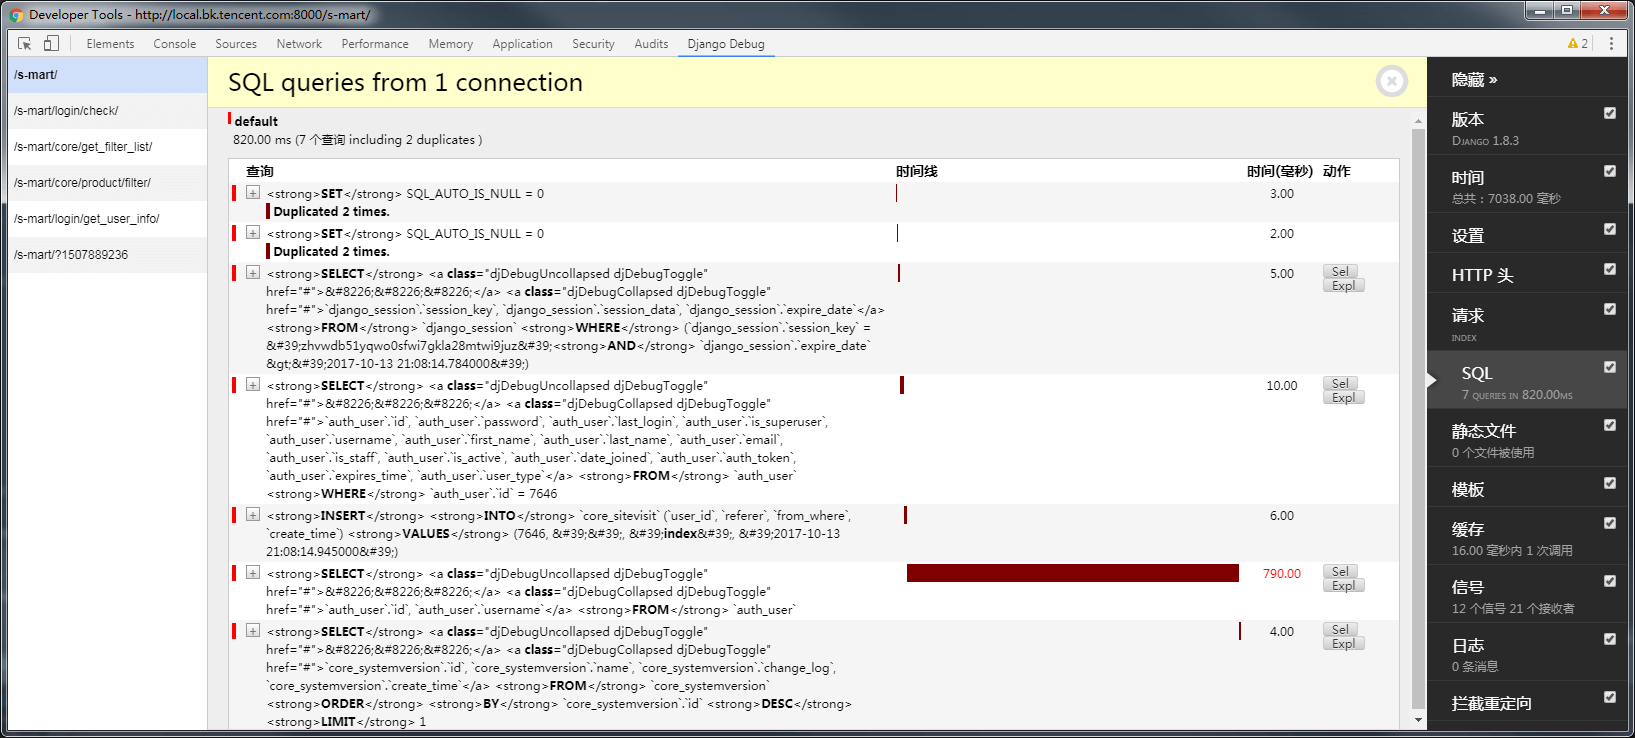
django-debug-panel builds on django-debug-toolbar and offers better support for single-page applications and Ajax requests.
- Install
| |
- Configure
settings.py
| |
Use panel’s middleware in place of toolbar’s middleware.
middlewares.py
| |
Install the Chrome extension: Django Debug Panel
Once configured successfully, you can see the related performance inspection data:
4.3 Analyzing requests Calls with django-debug-toolbar-requests
Often we use the requests library to call third-party APIs. The performance of those third-party APIs also needs attention. django-debug-toolbar-requests builds on django-debug-toolbar and adds support for requests calls.
- Install
| |
- Configure
| |
Add RequestsDebugPanel to DEBUG_TOOLBAR_PANELS
| |
Once configured successfully, you can see the related performance inspection data:
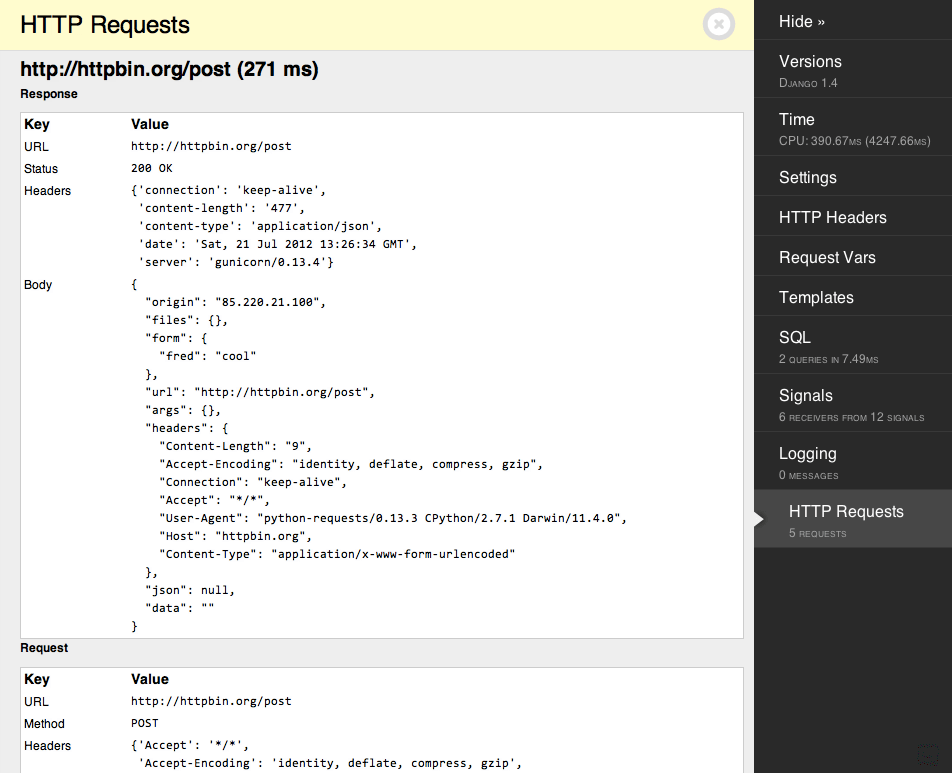
4.4 Django Database Optimization
- Add indexes to frequently searched fields
When defining a Model in Django, you can add an index to a field with db_index=True:
| |
Adding indexes to key fields gives a big performance boost, especially when the data volume is large and there are many query operations. See this document for reference
But indexes are not “the more the better.” An index can greatly speed up data queries, but it slows down inserts, deletes, and updates to the table. Striking the right balance matters.
- Use QuerySets caching sensibly
Django’s QuerySets have a cache; once fetched, they stay in memory for a while. Look at this example:
| |
| |
Calls to functions such as all, count, and exists require connecting to the database, but attribute access does not. For custom attributes, use cached_property to add a caching strategy — see this document for reference.
- Use iterator() to fetch objects and avoid QuerySets memory consumption
| |
A QuerySet caches its results so that repeated evaluation does not cause extra queries. iterator(), by contrast, reads results directly and performs no caching at the QuerySet level. For a QuerySet that returns a large number of objects that are accessed only once, this gives better performance and significantly reduces memory usage.
- Prefer batch operations
Batch operations can effectively reduce the number of database connections.
Batch insert data
| |
Batch update data
| |
Batch delete data
| |
Many-to-many relations
| |
4.5 Using Cache Sensibly
Caching is a sharp tool for optimizing performance. The idea behind caching is to trade space for time and avoid repeated computation.
Common caching approaches in Django:
- Development/debug cache
- In-memory cache
- File cache
- Database cache
- Memcache (using the python-memcached module)
- Memcache (using the pylibmc module)
By granularity, caching can be divided more finely:
- Site-wide cache
Just add the middleware:
| |
- View-level cache
| |
- Template fragment cache
| |
- Custom cache
The django.core.cache.caches provided by Django lets users set up and maintain caches themselves.
| |
- Cache in threads
Besides Django’s built-in caching mechanism, Python’s dynamic nature allows even finer-grained caching at the thread level:
| |
Caching data in the current thread’s local works well for scenarios that access the same cache multiple times within a single request.
In effect, this is using an in-memory cache.
4.4 Code Logic Optimization
- Remember to compile regular expressions
| |
Prefer .sort() for sorting
- O(nlogn)
- Using key is more efficient than cmp
Use list iterable expressions
| |
The list comprehension is 36% faster than the above
| |
- Reduce function calls, prefer accessing local variables
| |
After reducing function calls, it is 40% faster than the above
| |
- Use a set to test element existence
| |
After using a set, it is 70000% faster than the above
| |
