1. About Django’s Performance
Django is a web application framework written in Python. With Django you can develop complex, data-driven websites very simply and efficiently. At the same time, Django pays close attention to component reusability, pluggability, agile development, and DRY (Don’t Repeat Yourself). To a certain extent, Django is an application framework very well suited to implementing business logic.
I once used Docker to run a Django performance test, and the conclusion was that on a laptop configured with an Intel i5-5300 2.3GHz, 8GB of memory, and an SSD, Django’s DB-reading endpoint handled only 360 requests per second concurrently.
Django sacrifices performance, lowers the learning cost, and improves development efficiency. In general, you can optimize Django’s performance in the following areas:
- Database. Adding a cache is probably the most direct method, and you can also optimize the query statements
- Templates. Django’s built-in templates are relatively slow; you can try Mako, Jinja2
- Python. Upgrade to Python 3 and take advantage of the new features in Python 3, such as asyncio
How do you find Django’s performance bottlenecks? You can focus on the following aspects:
- How many SQL statements were executed
- How much time was spent on the database
- What special query operations were executed, and how long each query took
- What code generated these queries
- Which templates were used to render the page
- How cold/hot caching affects performance
The vast majority of performance bottlenecks are in the database part. Below we introduce the Django performance inspection tool django-debug-tools, a very powerful Django performance inspection tool.
2. django-debug-tools
2.1 Installation
| |
2.2 Configuration
settings.py
| |
If the Panel does not show up after configuration, then what you need is the following configuration
| |
url.py
```python
from django.conf import settings
from django.conf.urls import include, url

if settings.DEBUG:
    import debug_toolbar
    urlpatterns = [
        url(r'^__debug__/', include(debug_toolbar.urls)),
    ] + urlpatterns
2.3 Usage
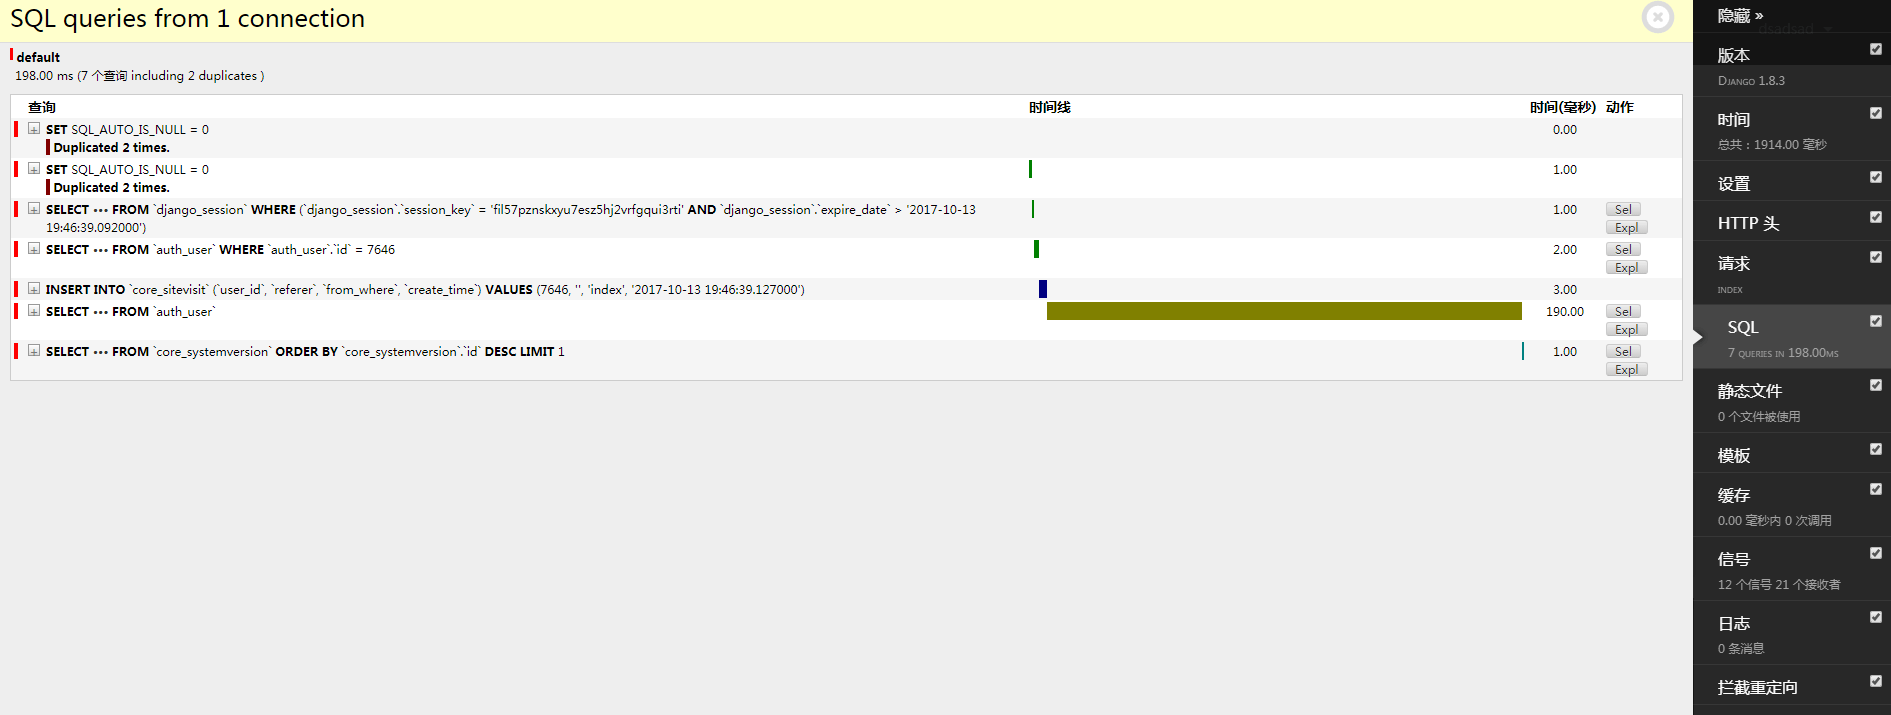
Restart the Django project, and you will see the Panel on the right side of the page, offering Panels for various parameters; click to view them.
3. django-debug-panel
django-debug-toolbar is a good Django performance inspection tool, but django-debug-toolbar cannot handle Ajax and non-HTML requests. django-debug-panel, building on django-debug-toolbar, provides better support for single-page applications and Ajax requests.
3.1 Installation
| |
3.2 Configuration
First, install and configure django-debug-toolbar.
settings.py
| |
Use panel’s middleware in place of toolbar’s middleware.
middlewares.py
| |
Install the Chrome extension Django Debug Panel
3.3 Usage
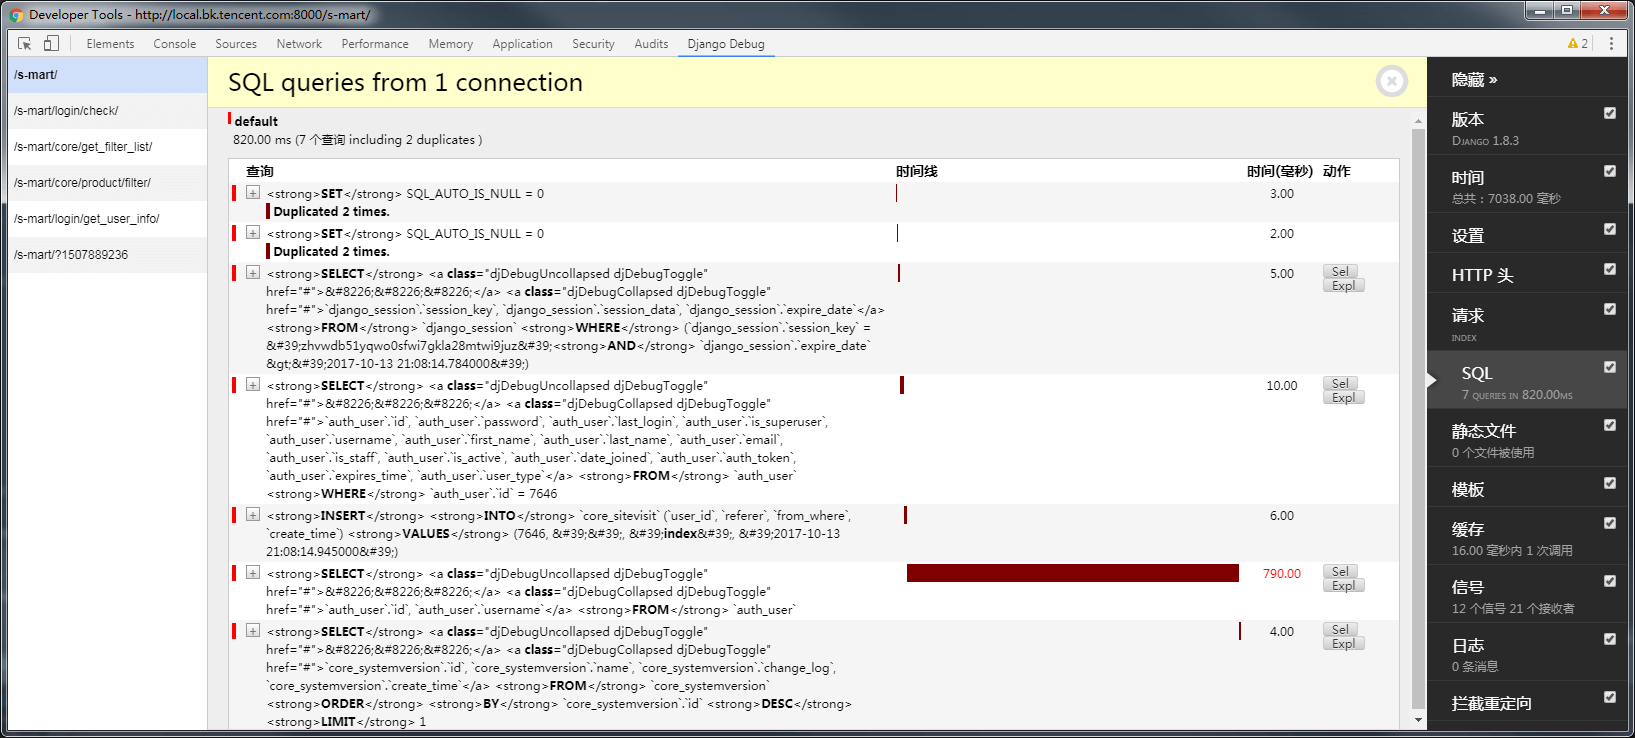
Restart the Django project and the Chrome debugging panel. Refresh the page, and you will see the SQL and other related information corresponding to each endpoint.
4. Third-Party Panels
django-debug-toolbar also has a number of third-party Panels, which can be integrated very conveniently with other Python performance inspection tools.
4.1 Line Profiler
debug_toolbar_line_profiler.panel.ProfilingPanel
Line Profiler can analyze functions line by line, and is mainly used for CPU-intensive performance inspection.
4.2. Pympler
pympler.panels.MemoryPanel
Pympler is a development tool for viewing and monitoring the memory of Python objects.
