This post comes mainly from an internal sharing session, and is also a summary of some recent work.
1. The Common Failure Handling Process
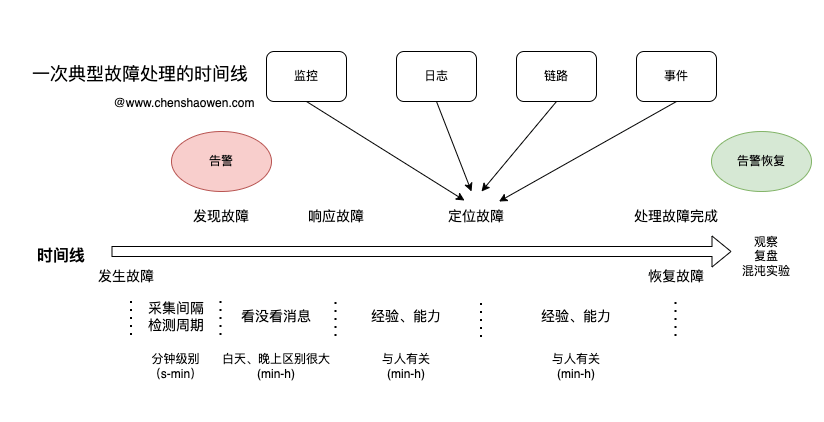
The figure above shows a typical operations exception handling process.
Along the timeline, there are the following key points in time:
- Failure occurs
- Failure detected
- Failure responded to
- Failure located
- Failure recovered
From failure occurrence to failure detection refers to the failure being detected by the system, which mainly involves the metric collection interval and the detection interval. With a 15 s collection interval and a 1 min detection interval, the time to detect a failure is on the order of tens of seconds to a few minutes.
From failure detection to failure response refers to the time between receiving the alert and a person starting to work on it. The difference between day and night is large, and so is the difference between working hours and non-working hours. At night, everyone is resting, and an alert may go unresponded to for hours; during the day, operations staff can jump in within minutes during working hours and begin locating the failure.
From failure response to failure localization refers to finding the cause of the failure. This time is closely related to a person’s experience and ability: a new hire may not be able to locate the failure even after several hours, while a veteran operations engineer familiar with the infrastructure may find the problem within minutes.
From failure localization to failure recovery refers to fixing the failure and restoring the online SLO. This part is similar to the previous one, but the abilities it demands differ: for example, if the program has a bug, operations can quickly locate the failure, but the fix still requires an R&D engineer to get involved.
Altogether these are five stages and four time intervals. In fact, afterwards there is still SLO observation, postmortems, optimization, and chaos experiment validation, but those are not part of the failure handling process.
2. The Stages an LLM Can Take Part In
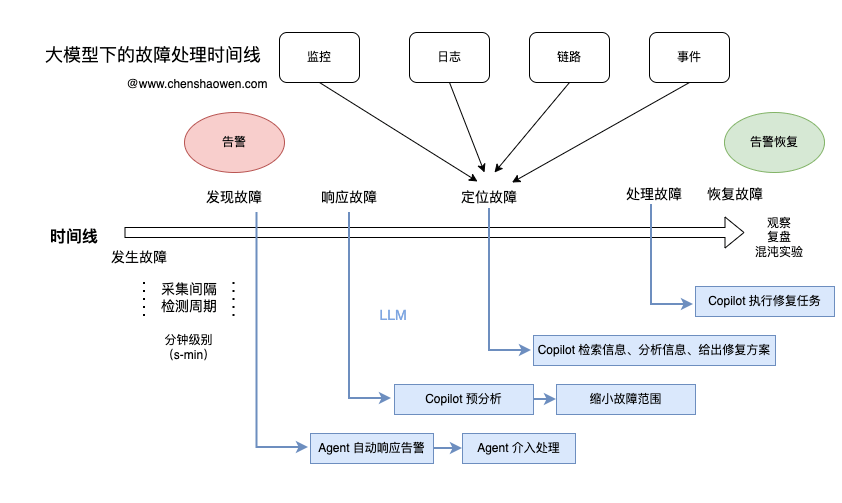
As shown above, in my analysis it can get involved mainly at four points: failure detection, failure response, failure localization, and failure handling.
2.1 Failure Detection
When a failure is detected, a person has not had time to respond yet.
If the LLM could get involved automatically and respond to the alert, we would get the fastest possible response, the greatest benefit, and a drastic reduction in the mean time to handle a failure, MTTF.
But having the LLM get involved immediately upon detection is also the hardest. The difficulty is that you need to develop an AI Agent that automatically responds to alert messages, automatically collects observability metrics, automatically calls platform APIs, and even logs into machines to try to fix the failure and verify whether it has been fixed — over and over again.
If you have written code or agents, you know this is quite hard. And if you think it is easy, you may be overestimating the intelligence of LLMs and underestimating the complexity of real-world problems.
2.2 Failure Response
When responding to a failure, if the LLM can immediately do a preliminary analysis of the failure, narrowing the scope of handling it helps speed up localization.
The LLM’s pre-analysis depends on the failure handling materials accumulated in normal times, which requires us to record and analyze every aspect of a failure in detail each time one occurs.
Only with enough accumulated failure data and root cause data can we effectively use the LLM to narrow the failure scope.
2.3 Failure Localization
Observability has expanded again — events have been added — and together with the earlier monitoring metrics, logs, and traces, there are more data sources, but each time you localize a failure there are also more platforms to query.
The LLM can help us effectively shorten the time spent querying these observability metrics.
At the same time, based on some keywords, it can search the document library, analyze the cause of the failure, and give some fixes, saving us the time spent searching online.
2.4 Failure Handling
The LLM can also be used to handle failures directly.
Recall how we often handle failures: restart a Deployment, restart the Kubelet, adjust a routing configuration, try a different node, and so on. These are usually just one command, one API call, or one button click.
Having the LLM perform these operations for us saves a lot of time and trouble.
2.5 Summary
There are actually many stages the LLM can take part in, but in terms of difficulty, the earlier it gets involved the harder it is, and the later it gets involved the easier it is to implement.
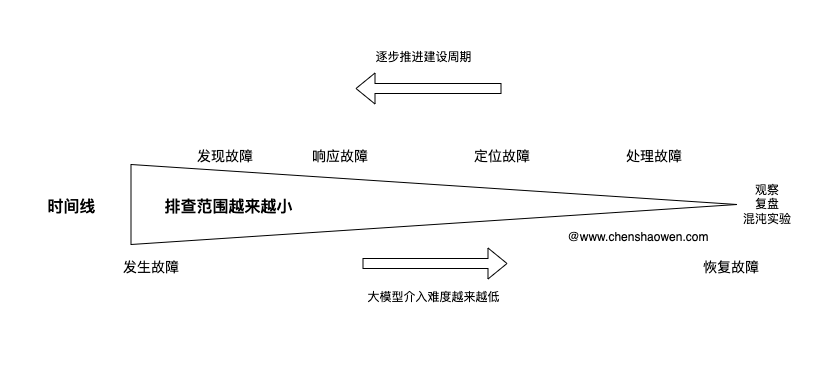
In the early phase of a failure the scope involved is too large, and it is hard for the LLM to effectively capture the key root cause, while human experience, flexibility, and autonomous learning ability show their advantages.
Yet the actual rollout of the LLM works the other way around: first use the LLM for later-stage handling, gradually accumulate the relevant documents and cases, then push the point of involvement earlier, until an AI Agent can fully automate failure response.
3. Challenges When Using LLMs to Handle Failures
3.1 How Text Becomes an Operations Action
For the LLM services we know well, the typical inputs and outputs are text, images, and video.
Converting these static outputs into a concrete action, the execution of a command, an operations action — that is the first problem we have to face.
3.2 The Information the LLM Extracts Is Unstable
For a program, determinism is very important, but the appeal of LLMs is precisely their uncertainty and diversity. When you start writing LLM applications you easily run into these problems:
- The LLM does not understand the intent and apologizes repeatedly
- The output format is wrong
- The output is missing parameters
- …
There will be many problems like these. We usually break through from the following angles:
- Prompts
- Retries
- Fine-tuning the model
Of course, the other key point I want to raise this time is to solve it at the application design level.
3.3 How to Onboard Scenarios Quickly
Fast validation and fast iteration should be in every engineer’s DNA. How to quickly connect to various scenarios so that our solution does not look too absurd and even feels somewhat effective is very important.
Here I chose some everyday chores:
- Handling alert events
- Assisting with daily operations
But these two broad categories have a great many sub-items — dozens or even hundreds of scenarios. What came to mind was the idea of plugin orchestration. If you can abstract atomic operations and stitch atoms together into pipelines, you can cover countless scenarios.
4. Key Technology for Rollout - Introducing Ops
Every domain may need a project like Ops to provide the ability to drive that domain with LLMs. Below is a brief introduction to Ops.
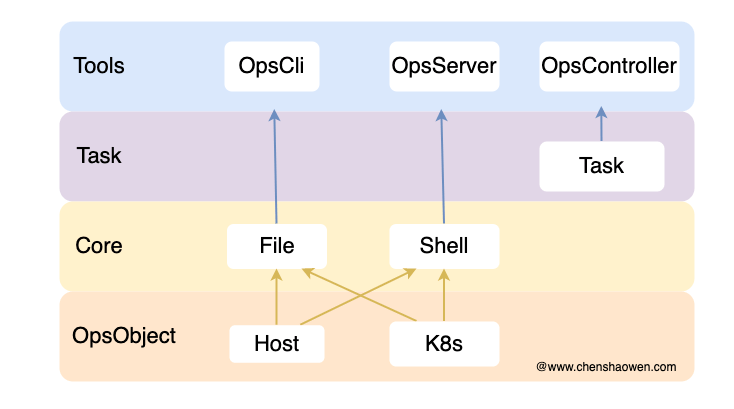
- OpsObject
Stores operation objects via CRDs, managing cluster and host objects.
- Core
Core operations, implementing file distribution and script execution capabilities.
- Task
Encapsulates and combines various operations — lightweight orchestration capability.
- Tools
Provides three entry points for operations to the outside
The Ops project is the key to connecting operations capabilities. I have introduced it several times in previous articles; if you are interested, go to https://www.chenshaowen.com/ops/ for details.
4.1 Usage Example - Viewing Objects
- View operations objects

You can see key information such as the cluster’s node count and the remaining days before certificate expiry.

You can see node configuration and the near-real-time status of GPU cards.
4.2 Usage Example - Opscli
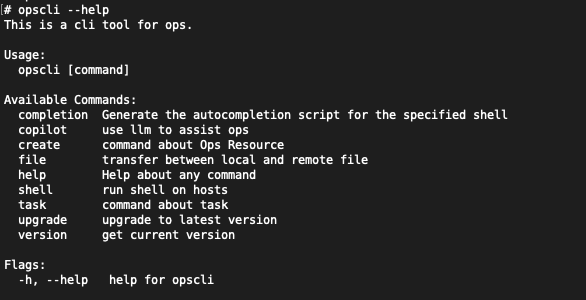
- shell is used to run scripts on hosts
- file is used to transfer files between hosts and S3, file services, and images
- task is used to orchestrate multiple shell\file operations
- Supports running commands on specified nodes with only a kubeconfig credential
- Also supports SA authentication in Kubectl
4.3 Usage Example - Web UI
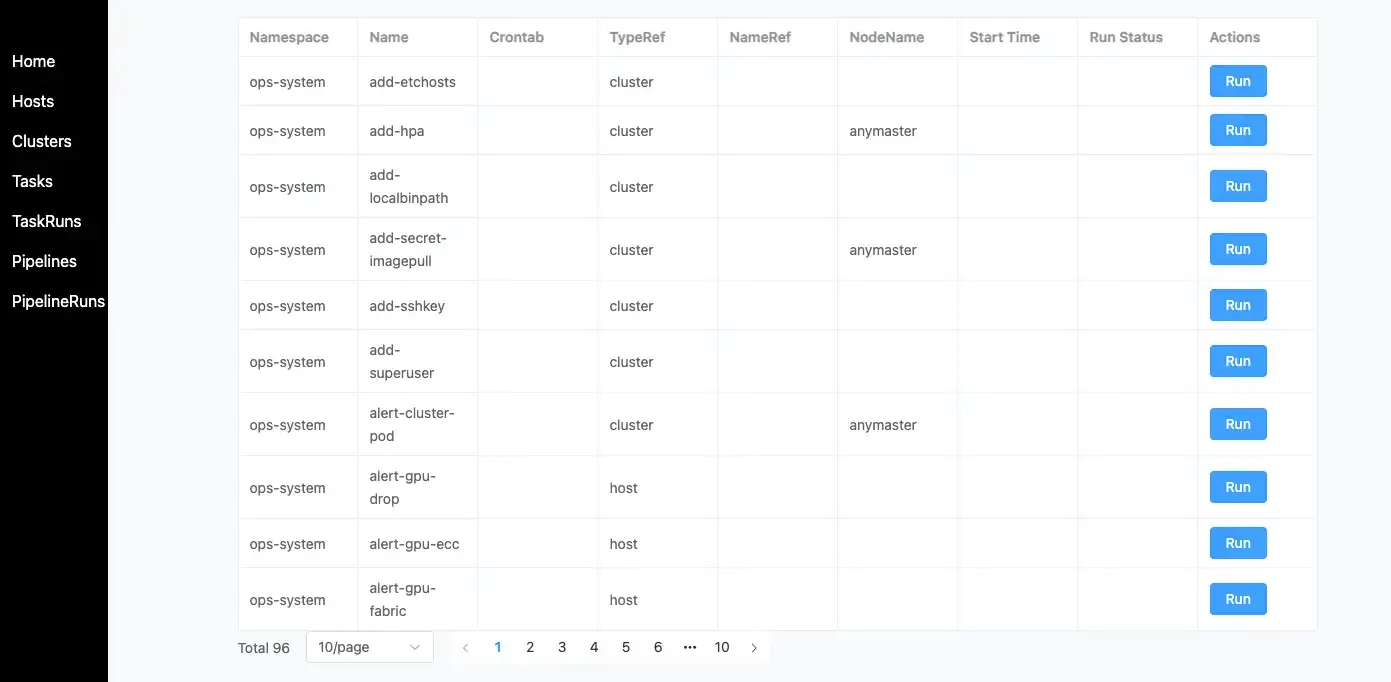
Use the core capabilities of Ops in a simpler way:
- Server provides the API capability
- Web provides a simple management UI
4.4 Usage Example - Task
Task provides a templating capability; you only need to define a task first.
| |
Then reference this task in a TaskRun and it can be executed.
| |
5. The Design of Copilot
Copilot is currently the main form in which we put LLMs to work handling operations failures. Through interactive conversation, we let the LLM take part in the failure handling process. Following the approach above, we get involved in the later stages of failure handling first, then roll out to the earlier stages, using a strategy of accumulating and advancing layer by layer.
5.1 Key Steps
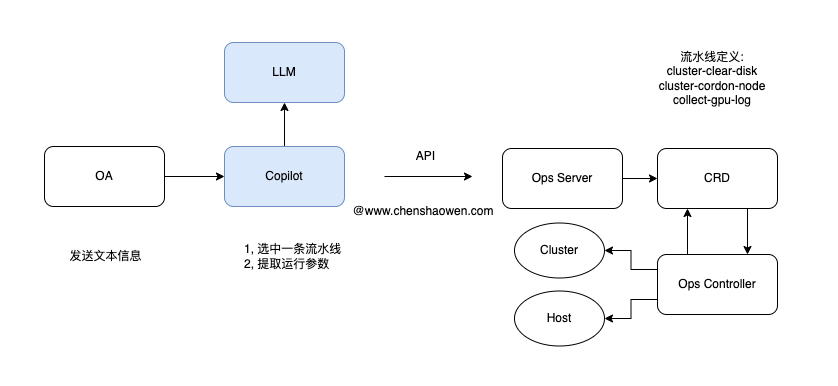
The core idea:
- Provide Copilot with operations capabilities through the Ops project
- Provide the ability to connect operation scenarios through pipelines
The core steps:
Step one: the LLM picks a pipeline for us
Step two: the LLM extracts the parameters for running the pipeline from the failure context
This is similar to the function_call feature, except that what is called is not a function but a pipeline. Using pipelines to connect scenarios has many benefits: they can handle more complex tasks and are not limited by model features.
At present, any LLM that supports the OpenAI API can connect to Copilot’s pipelines. However, since they have not been fine-tuned for the operations failure handling domain, the model used cannot have too few parameters — it requires a certain level of comprehension.
5.2 Pipeline Design
The design goals of pipelines are:
- Make it easy for the LLM to recognize intent and select a pipeline to execute
- Make it easy to extend and cover more scenarios
- Make it easy for the LLM to assemble tasks itself into new pipelines, providing a viable path toward an AI Agent
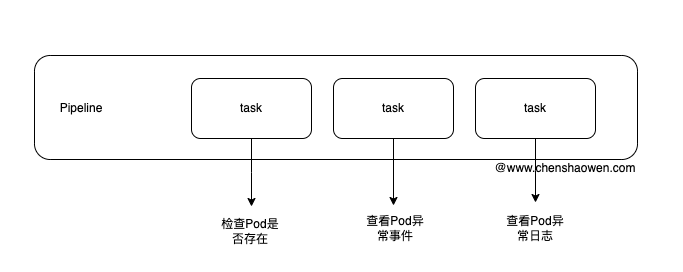
I am very familiar with orchestration systems such as CICD, so it was easy to write this pipeline object and the concrete execution logic in code.
So far we have defined:
- 95 tasks
- 20 pipelines
Also, since tasks and pipelines are both CR objects, you only need to write Yaml to quickly connect a scenario, which is very convenient.
The input finally submitted to the LLM looks like this:
| |
5.3 Variable Design
Variable design is so important that you only appreciate it when you have actually written an LLM application.
First, the definition of parameters:
- Default value
- Description
- Regex
- Required or not
- Enum
- Example
- Fixed value
Next, parameter precedence:
- task fixed value
- pipeline fixed value
- value extracted at runtime
Through variable design we get the following benefits:
- Variable definitions improve the accuracy of parameter extraction
- task fixed values improve the execution success rate
e.g. run only on master nodes - pipeline fixed values supply sensitive information
e.g. the ak\sk for uploading to S3
Below is the input I submitted to the LLM:
| |
6. Detect Failures Proactively, Get the Flywheel Spinning
If you just wait passively for failures, it will take forever to accumulate enough data; the best approach is always to go on the offensive.
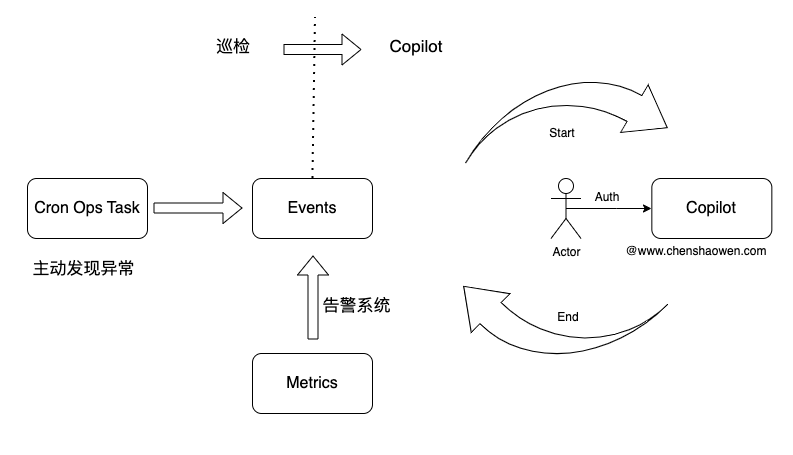
Inspections can proactively find some potential problems and warn early before a failure occurs.
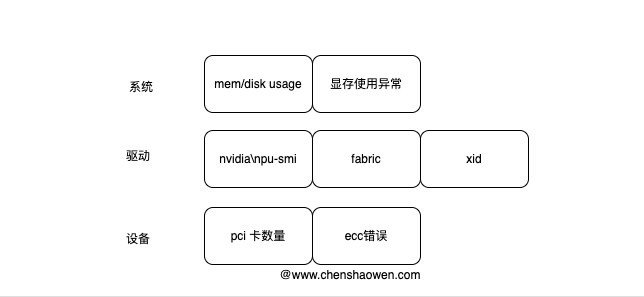
Our inspections now cover several areas: the device layer, the driver layer, the system layer, and so on. Nodes newly added to the cluster can also join inspections automatically.
Configuring an inspection is very simple too — remember the TaskRun object above?
| |
You only need to add crontab: 0 0 * * * to the TaskRun to start periodic execution; in this example it clears the disk every day at eight o’clock. An inspection task just needs some inspection logic written in the Task, plus triggering an alert notification and pushing a warning event.
7. A Typical Case
The content above may still lack an intuitive feel, so let me introduce a typical case.
AI accelerator cards work in high-temperature environments and often have various exceptions and errors. Unlike CPUs, which self-protect by throttling heavily, an AI accelerator card can drop out (the system layer and driver layer can no longer recognize the hardware’s state) and becomes directly unusable. In thousand-card training, on average at least one card goes abnormal every day.
When a GPU card drops out, it has to be reported for repair and a cloud vendor engineer resolves it on site. Below is the traditional repair request process.
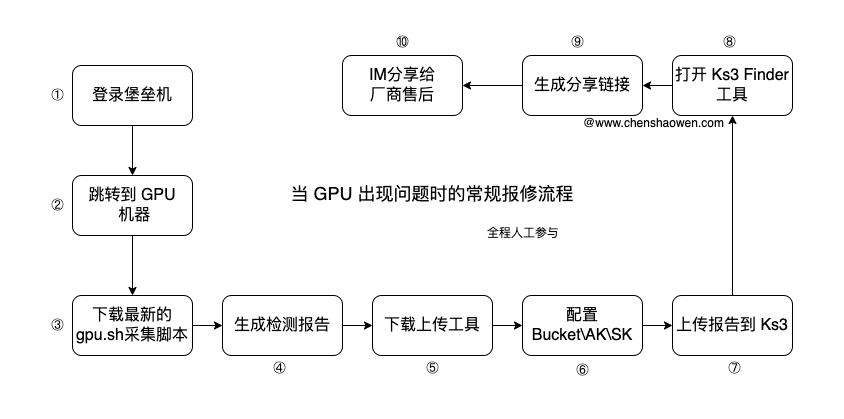
Now you only need to @ Copilot in IM.
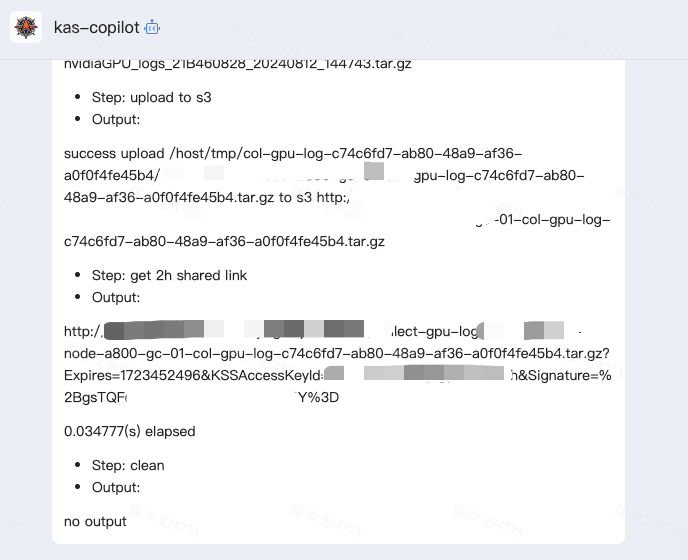
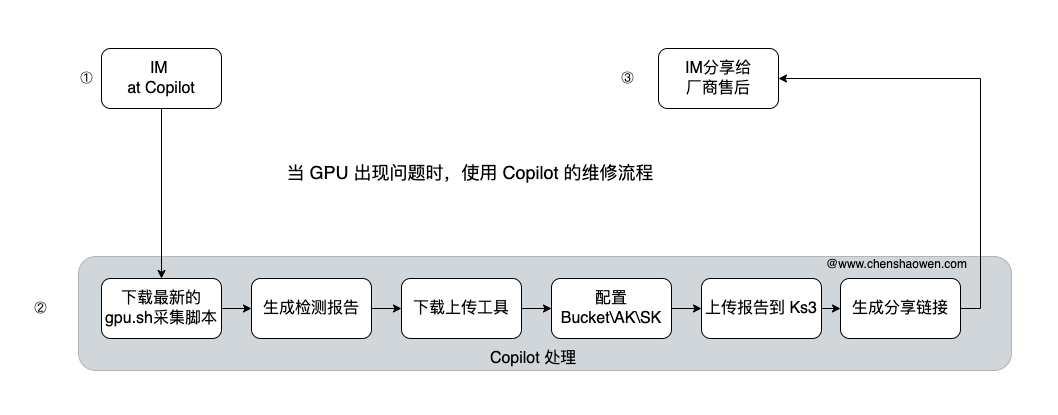
Handling time dropped from tens of minutes to a few minutes, and security is improved as well, avoiding AK/SK leakage.
Besides this case, which greatly improves efficiency in process and time, what I value even more is that handling failures is no longer constrained by time or whether remote work is possible — it can be done anytime, anywhere.
8. Summary
This post introduced some of my practices in using LLMs to handle operations failures, and I hope it helps everyone design and develop LLM applications. The main content is as follows:
- The timeline of the failure handling process and the stages an LLM can take part in
- An LLM can take part in almost all failure handling stages, including failure detection, response, localization, and handling
- When starting to use an LLM to handle failures, begin with the stage closest to resolving the failure and gradually push forward
- If you also work in operations-related roles, give the https://github.com/shaowenchen/ops project a try
function_callis one way of thinking; do not limit yourself tofunction— it can also be a pipeline, workflow, or any other programmable object- When developing LLM applications, the description of variables is extremely important
