1. Mount a Memory Storage Directory on the Host
- Create a directory to mount
1
| mkdir /mnt/memory_storage
|
- Mount the tmpfs filesystem
1
| mount -t tmpfs -o size=800G tmpfs /mnt/memory_storage
|
Storage is allocated on demand, so using 100G of storage only consumes 100G of memory. The host node has 2T of memory, and here 800G is allocated to store Elasticsearch data.
- Create the directories in advance
1
2
3
| mkdir /mnt/memory_storage/elasticsearch-data-es-jfs-prod-es-default-0
mkdir /mnt/memory_storage/elasticsearch-data-es-jfs-prod-es-default-1
mkdir /mnt/memory_storage/elasticsearch-data-es-jfs-prod-es-default-2
|
If the directories are not created in advance and given read/write permissions, the Elasticsearch component will fail to start, complaining that multiple nodes use the same data directory.
- Configure directory permissions
1
| chmod -R 777 /mnt/memory_storage
|
1
2
3
4
5
| dd if=/dev/zero of=/mnt/memory_storage/dd.txt bs=4M count=2500
2500+0 records in
2500+0 records out
10485760000 bytes (10 GB, 9.8 GiB) copied, 3.53769 s, 3.0 GB/s
|
Clean up the file
1
| rm -rf /mnt/memory_storage/dd.txt
|
- FIO test for IO bandwidth
1
2
3
4
| fio --name=test --filename=/mnt/memory_storage/fio_test_file --size=10G --rw=write --bs=4M --numjobs=1 --runtime=60 --time_based
Run status group 0 (all jobs):
WRITE: bw=2942MiB/s (3085MB/s), 2942MiB/s-2942MiB/s (3085MB/s-3085MB/s), io=172GiB (185GB), run=60001-60001msec
|
Clean up the file
1
| rm -rf /mnt/memory_storage/fio_test_file
|
 1
 2
 3
 4
 5
 6
 7
 8
 9
10
11
12
13
14
15
16
17
18
19
20
21
22
23
24
25
26
27
28
29
30
31
32
33
34
35
36
37
38
| mbw 10000
Long uses 8 bytes. Allocating 2*1310720000 elements = 20971520000 bytes of memory.
Using 262144 bytes as blocks for memcpy block copy test.
Getting down to business... Doing 10 runs per test.
0 Method: MEMCPY Elapsed: 1.62143 MiB: 10000.00000 Copy: 6167.380 MiB/s
1 Method: MEMCPY Elapsed: 1.63542 MiB: 10000.00000 Copy: 6114.656 MiB/s
2 Method: MEMCPY Elapsed: 1.63345 MiB: 10000.00000 Copy: 6121.997 MiB/s
3 Method: MEMCPY Elapsed: 1.63715 MiB: 10000.00000 Copy: 6108.161 MiB/s
4 Method: MEMCPY Elapsed: 1.64429 MiB: 10000.00000 Copy: 6081.667 MiB/s
5 Method: MEMCPY Elapsed: 1.62772 MiB: 10000.00000 Copy: 6143.574 MiB/s
6 Method: MEMCPY Elapsed: 1.60684 MiB: 10000.00000 Copy: 6223.379 MiB/s
7 Method: MEMCPY Elapsed: 1.62499 MiB: 10000.00000 Copy: 6153.876 MiB/s
8 Method: MEMCPY Elapsed: 1.63967 MiB: 10000.00000 Copy: 6098.770 MiB/s
9 Method: MEMCPY Elapsed: 2.97213 MiB: 10000.00000 Copy: 3364.588 MiB/s
AVG Method: MEMCPY Elapsed: 1.76431 MiB: 10000.00000 Copy: 5667.937 MiB/s
0 Method: DUMB Elapsed: 1.01521 MiB: 10000.00000 Copy: 9850.140 MiB/s
1 Method: DUMB Elapsed: 0.85378 MiB: 10000.00000 Copy: 11712.605 MiB/s
2 Method: DUMB Elapsed: 0.82487 MiB: 10000.00000 Copy: 12123.167 MiB/s
3 Method: DUMB Elapsed: 0.84520 MiB: 10000.00000 Copy: 11831.463 MiB/s
4 Method: DUMB Elapsed: 0.83050 MiB: 10000.00000 Copy: 12040.968 MiB/s
5 Method: DUMB Elapsed: 0.84932 MiB: 10000.00000 Copy: 11774.194 MiB/s
6 Method: DUMB Elapsed: 0.82491 MiB: 10000.00000 Copy: 12122.505 MiB/s
7 Method: DUMB Elapsed: 1.44235 MiB: 10000.00000 Copy: 6933.144 MiB/s
8 Method: DUMB Elapsed: 2.68656 MiB: 10000.00000 Copy: 3722.225 MiB/s
9 Method: DUMB Elapsed: 8.44667 MiB: 10000.00000 Copy: 1183.898 MiB/s
AVG Method: DUMB Elapsed: 1.86194 MiB: 10000.00000 Copy: 5370.750 MiB/s
0 Method: MCBLOCK Elapsed: 4.52486 MiB: 10000.00000 Copy: 2210.013 MiB/s
1 Method: MCBLOCK Elapsed: 4.82467 MiB: 10000.00000 Copy: 2072.683 MiB/s
2 Method: MCBLOCK Elapsed: 0.84797 MiB: 10000.00000 Copy: 11792.870 MiB/s
3 Method: MCBLOCK Elapsed: 0.84980 MiB: 10000.00000 Copy: 11767.516 MiB/s
4 Method: MCBLOCK Elapsed: 0.87665 MiB: 10000.00000 Copy: 11407.113 MiB/s
5 Method: MCBLOCK Elapsed: 0.85952 MiB: 10000.00000 Copy: 11634.468 MiB/s
6 Method: MCBLOCK Elapsed: 0.84132 MiB: 10000.00000 Copy: 11886.154 MiB/s
7 Method: MCBLOCK Elapsed: 0.84970 MiB: 10000.00000 Copy: 11768.915 MiB/s
8 Method: MCBLOCK Elapsed: 0.86918 MiB: 10000.00000 Copy: 11505.150 MiB/s
9 Method: MCBLOCK Elapsed: 0.85996 MiB: 10000.00000 Copy: 11628.434 MiB/s
AVG Method: MCBLOCK Elapsed: 1.62036 MiB: 10000.00000 Copy: 6171.467 MiB/s
|
It seems the IO bandwidth of memory mounted as a filesystem only reaches about half the IO bandwidth of raw memory.
2. Create PVCs on the Kubernetes Cluster
- Configure environment variables
1
2
| export NAMESPACE=data-center
export PVC_NAME=elasticsearch-data-es-jfs-prod-es-default-0
|
 1
 2
 3
 4
 5
 6
 7
 8
 9
10
11
12
13
14
15
16
17
18
19
20
21
22
23
24
25
26
| kubectl create -f - <<EOF
apiVersion: v1
kind: PersistentVolume
metadata:
name: ${PVC_NAME}
namespace: ${NAMESPACE}
spec:
accessModes:
- ReadWriteMany
capacity:
storage: 800Gi
hostPath:
path: /mnt/memory_storage/${PVC_NAME}
---
apiVersion: v1
kind: PersistentVolumeClaim
metadata:
name: ${PVC_NAME}
namespace: ${NAMESPACE}
spec:
accessModes:
- ReadWriteMany
resources:
requests:
storage: 800Gi
EOF
|
By changing the PVC_NAME variable, create at least 3 PVC applications; in the end I created 10 PVCs, providing 15+ TB of storage in total.
3. Deploy the Elasticsearch Components
Some content is omitted here; for details see Storing Elasticsearch Data in JuiceFS.
 1
 2
 3
 4
 5
 6
 7
 8
 9
10
11
12
13
14
15
16
17
18
19
20
21
22
23
24
25
26
27
28
29
30
31
32
33
34
35
36
37
38
39
40
41
42
43
44
45
46
47
48
49
50
51
52
53
54
55
56
57
58
59
60
61
62
63
64
65
| cat <<EOF | kubectl apply -f -
apiVersion: elasticsearch.k8s.elastic.co/v1
kind: Elasticsearch
metadata:
namespace: $NAMESPACE
name: es-jfs-prod
spec:
version: 8.12.0
image: elasticsearch:8.12.0
http:
tls:
selfSignedCertificate:
disabled: true
nodeSets:
- name: default
count: 3
config:
node.store.allow_mmap: false
index.store.type: niofs
podTemplate:
spec:
nodeSelector:
servertype: Ascend910B-24
initContainers:
- name: sysctl
securityContext:
privileged: true
runAsUser: 0
command: ['sh', '-c', 'sysctl -w vm.max_map_count=262144']
- name: install-plugins
command:
- sh
- -c
- |
bin/elasticsearch-plugin install --batch https://get.infini.cloud/elasticsearch/analysis-ik/8.12.0 &&
bin/elasticsearch-plugin install --batch repository-s3 &&
bin/elasticsearch-plugin install --batch analysis-icu &&
echo xxx | bin/elasticsearch-keystore add --stdin --force s3.client.default.secret_key &&
echo xxx | bin/elasticsearch-keystore add --stdin --force s3.client.default.access_key
securityContext:
runAsUser: 0
runAsGroup: 0
containers:
- name: elasticsearch
readinessProbe:
exec:
command:
- bash
- -c
- /mnt/elastic-internal/scripts/readiness-probe-script.sh
failureThreshold: 10
initialDelaySeconds: 30
periodSeconds: 30
successThreshold: 1
timeoutSeconds: 30
env:
- name: "ES_JAVA_OPTS"
value: "-Xms31g -Xmx31g"
- name: "NSS_SDB_USE_CACHE"
value: "no"
resources:
requests:
cpu: 8
memory: 64Gi
EOF
|
- View the Elasticsearch password
1
2
3
| kubectl -n $NAMESPACE get secret es-jfs-prod-es-elastic-user -o go-template='{{.data.elastic | base64decode}}'
xxx
|
The default username is elastic
 1
 2
 3
 4
 5
 6
 7
 8
 9
10
11
12
13
14
15
16
17
18
19
20
21
22
23
24
25
26
27
28
29
30
31
32
33
34
35
36
37
38
39
40
41
42
43
44
| kubectl apply -f - <<EOF
apiVersion: beat.k8s.elastic.co/v1beta1
kind: Beat
metadata:
name: es-jfs-prod
namespace: $NAMESPACE
spec:
type: metricbeat
version: 8.12.0
elasticsearchRef:
name: es-jfs-prod
config:
metricbeat:
autodiscover:
providers:
- type: kubernetes
scope: cluster
hints.enabled: true
templates:
- config:
- module: kubernetes
metricsets:
- event
period: 10s
processors:
- add_cloud_metadata: {}
logging.json: true
deployment:
podTemplate:
spec:
serviceAccountName: metricbeat
automountServiceAccountToken: true
securityContext:
runAsUser: 0
containers:
- name: metricbeat
resources:
requests:
cpu: 1
memory: 1Gi
limits:
cpu: 4
memory: 4Gi
EOF
|
 1
 2
 3
 4
 5
 6
 7
 8
 9
10
11
12
13
14
15
16
17
| cat <<EOF | kubectl apply -f -
apiVersion: kibana.k8s.elastic.co/v1
kind: Kibana
metadata:
namespace: $NAMESPACE
name: es-jfs-prod
spec:
version: 8.12.0
count: 1
image: elastic/kibana:8.12.0
elasticsearchRef:
name: es-jfs-prod
http:
tls:
selfSignedCertificate:
disabled: true
EOF
|
- View the Elasticsearch cluster information
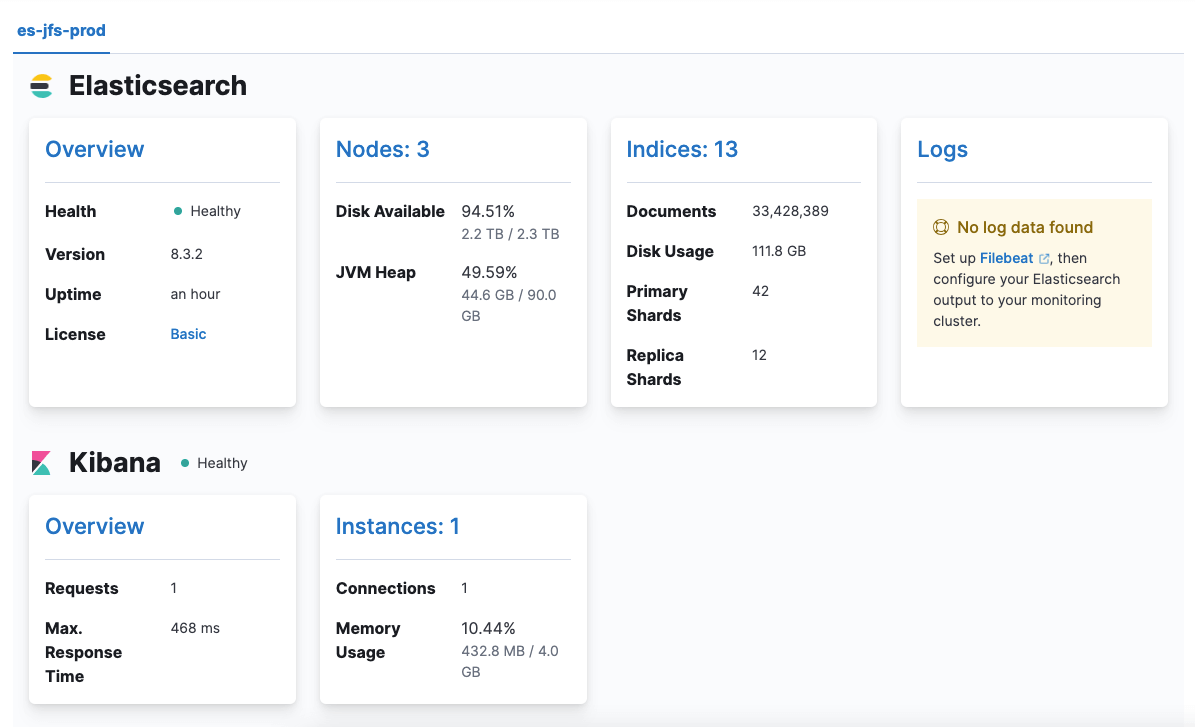
Mainly used to back up and restore indices
 1
 2
 3
 4
 5
 6
 7
 8
 9
10
| PUT /_snapshot/ks3
{
"type": "s3",
"settings": {
"bucket": "xxx",
"base_path": "datalake/prod/elastic-snapshot",
"region": "BEIJING",
"endpoint": "ks3-cn-beijing-internal.ksyuncs.com"
}
}
|
4. Import Data
Run this in the Dev Tools page of Elasticsearch Management:
 1
 2
 3
 4
 5
 6
 7
 8
 9
10
11
12
13
14
15
16
17
18
19
20
21
| PUT /bayou_tt_articles
{
"settings": {
"index": {
"number_of_shards": 30,
"number_of_replicas": 1,
"refresh_interval": "120s",
"translog.durability": "async",
"translog.sync_interval": "120s",
"translog.flush_threshold_size": "2048M"
}
},
"mappings": {
"properties": {
"text": {
"type": "text",
"analyzer": "ik_smart"
}
}
}
}
|
There are two things to watch out for:
- Keep the size of each shard between 10-50G. Here
number_of_shards is set to 30 because there are several hundred GB of data to import in total. - The replica count should be at least 1, to ensure that no data is lost while Pods are being rolled. When a Pod’s IP changes, Elasticsearch treats it as a new node and cannot reuse the previous data; at that point, if there is no replica to rebuild the shards, data will be lost.
You can also use the elasticdump container to import, and an example of that is given below. Here npm is used for the installation.
1
| npm install elasticdump -g
|
1
2
| export DATAPATH=./bayou_tt_articles_0.jsonl
nohup elasticdump --limit 20000 --input=${DATAPATH} --output=http://elastic:xxx@x.x.x.x:31391/ --output-index=bayou_tt_articles --type=data --transform="doc._source=Object.assign({},doc)" > elasticdump-${DATAPATH}.log 2>&1 &
|
limit is the number of records imported per batch; the default value of 100 is too small, so it is recommended to make it as large as possible on the premise that the import still succeeds.
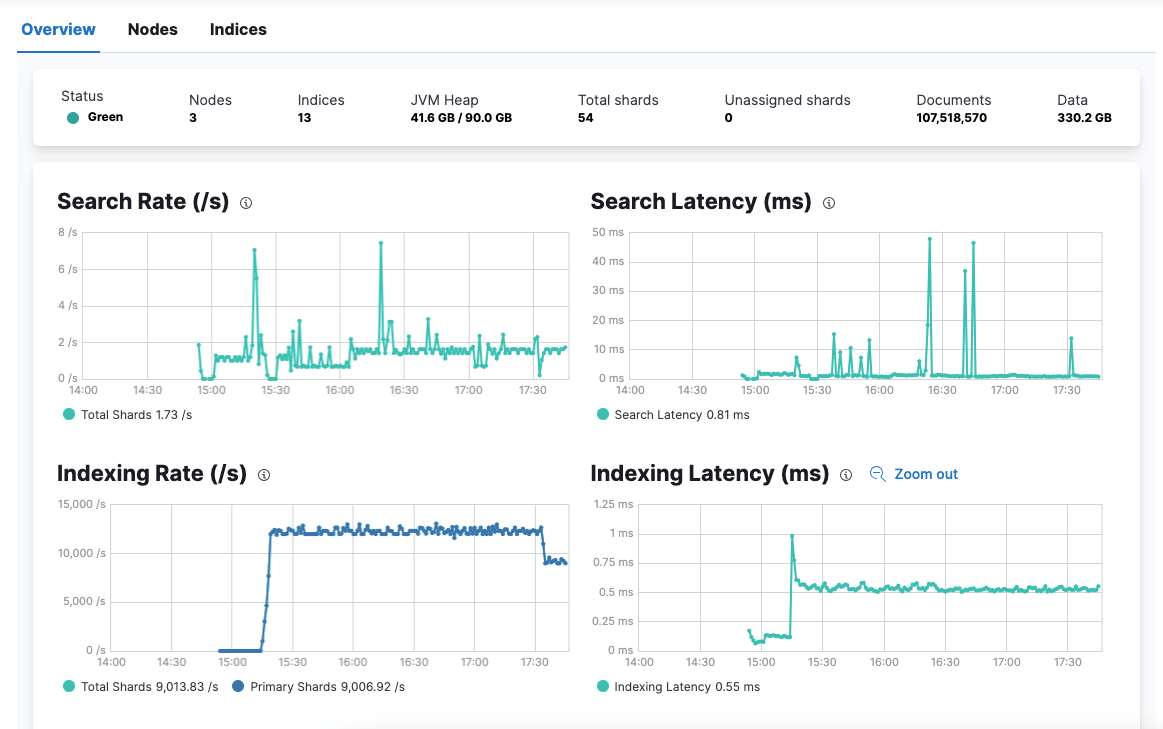
The indexing rate reached 1w+/s, but the ceiling is far beyond that. According to the community documentation’s stress test results, a single node can provide an indexing rate of at least 2W/s.
5. Testing and Verification
- Full-text search performance improved significantly
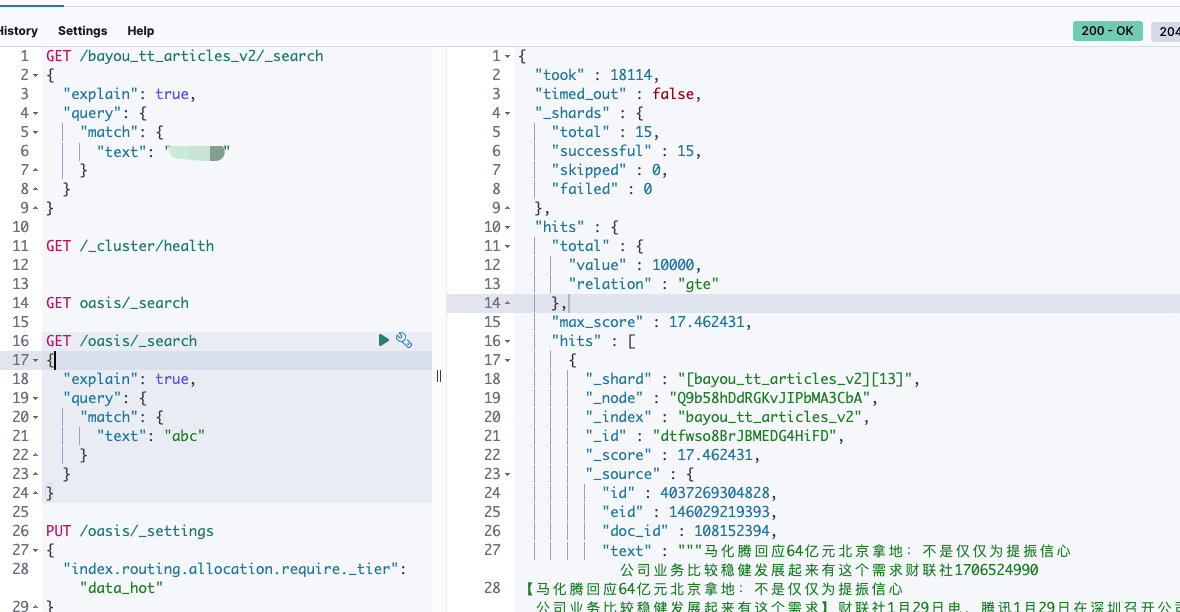
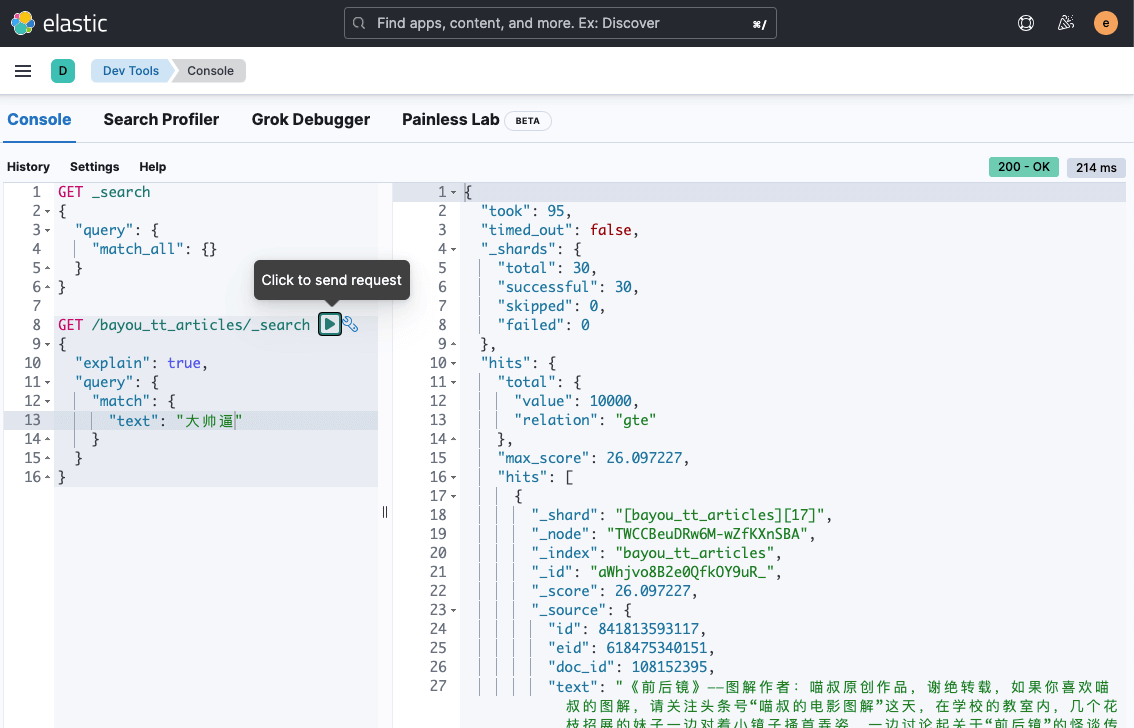
The figure above shows a full-text search speed of 18s with JuiceFS storage, and 5s with Elasticsearch on SSD nodes. The figure below shows a full-text search speed of around 100ms with memory storage.
- Updating Elasticsearch does not lose data
The CPU and Memory previously allocated to the Elasticsearch Pod were too generous, so they were adjusted to CPU 32C and Memory 64 GB. During the rolling update, Elasticsearch stayed available the whole time and no data was lost.
But be sure to set replicas > 1, and avoid restarting Pods on your own; even though a Pod is updated on its original node.
- Node scale-out can be done smoothly
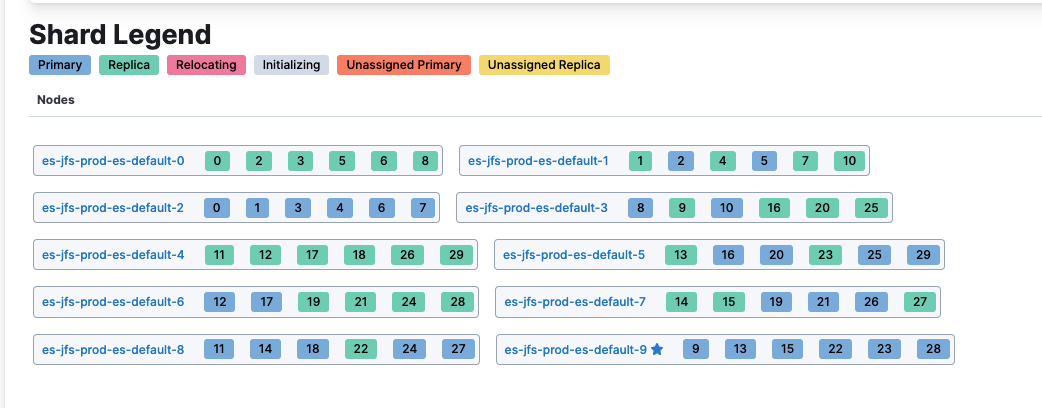
Since the business’s total Elasticsearch storage requirement is around 10T, I kept adding nodes up to 10, and Elasticsearch’s index shards migrated automatically and were distributed evenly across these nodes.
- Export speed reaches 1w records per second
1
| docker run --rm -ti elasticdump/elasticsearch-dump --limit 10000 --input=http://elastic:xxx@x.x.x.x:31391/bayou_tt_articles --output=/data/es-bayou_tt_articles-output.json --type=data
|
1
2
3
4
5
6
7
| Wed, 29 May 2024 01:41:23 GMT | got 10000 objects from source elasticsearch (offset: 0)
Wed, 29 May 2024 01:41:23 GMT | sent 10000 objects to destination file, wrote 10000
Wed, 29 May 2024 01:41:24 GMT | got 10000 objects from source elasticsearch (offset: 10000)
Wed, 29 May 2024 01:41:24 GMT | sent 10000 objects to destination file, wrote 10000
Wed, 29 May 2024 01:41:25 GMT | got 10000 objects from source elasticsearch (offset: 20000)
Wed, 29 May 2024 01:41:25 GMT | sent 10000 objects to destination file, wrote 10000
Wed, 29 May 2024 01:41:25 GMT | got 10000 objects from source elasticsearch (offset: 30000)
|
The export speed can reach 1w records per second; 100 million records take about 3h, which basically meets the needs of index backup and migration.
- Elasticsearch node Pods do not drift when updated
The Pod distribution across nodes before the update is as follows:
 1
 2
 3
 4
 5
 6
 7
 8
 9
10
11
12
13
| NAME READY STATUS RESTARTS AGE IP NODE NOMINATED NODE READINESS GATES
es-jfs-prod-beat-metricbeat-7fbdd657c4-djgg6 1/1 Running 6 (32m ago) 18h 10.244.54.5 ascend-01 <none> <none>
es-jfs-prod-es-default-0 1/1 Running 0 28m 10.244.46.82 ascend-07 <none> <none>
es-jfs-prod-es-default-1 1/1 Running 0 29m 10.244.23.77 ascend-53 <none> <none>
es-jfs-prod-es-default-2 1/1 Running 0 31m 10.244.49.65 ascend-20 <none> <none>
es-jfs-prod-es-default-3 1/1 Running 0 32m 10.244.54.14 ascend-01 <none> <none>
es-jfs-prod-es-default-4 1/1 Running 0 34m 10.244.100.239 ascend-40 <none> <none>
es-jfs-prod-es-default-5 1/1 Running 0 35m 10.244.97.201 ascend-39 <none> <none>
es-jfs-prod-es-default-6 1/1 Running 0 37m 10.244.101.156 ascend-38 <none> <none>
es-jfs-prod-es-default-7 1/1 Running 0 39m 10.244.19.101 ascend-49 <none> <none>
es-jfs-prod-es-default-8 1/1 Running 0 40m 10.244.16.109 ascend-46 <none> <none>
es-jfs-prod-es-default-9 1/1 Running 0 41m 10.244.39.119 ascend-15 <none> <none>
es-jfs-prod-kb-75f7bbd96-6tcrn 1/1 Running 0 18h 10.244.1.164 ascend-22 <none> <none>
|
The Pod distribution across nodes after the update is as follows:
 1
 2
 3
 4
 5
 6
 7
 8
 9
10
11
12
13
| NAME READY STATUS RESTARTS AGE IP NODE NOMINATED NODE READINESS GATES
es-jfs-prod-beat-metricbeat-7fbdd657c4-djgg6 1/1 Running 6 (50m ago) 18h 10.244.54.5 ascend-01 <none> <none>
es-jfs-prod-es-default-0 1/1 Running 0 72s 10.244.46.83 ascend-07 <none> <none>
es-jfs-prod-es-default-1 1/1 Running 0 2m35s 10.244.23.78 ascend-53 <none> <none>
es-jfs-prod-es-default-2 1/1 Running 0 3m59s 10.244.49.66 ascend-20 <none> <none>
es-jfs-prod-es-default-3 1/1 Running 0 5m34s 10.244.54.15 ascend-01 <none> <none>
es-jfs-prod-es-default-4 1/1 Running 0 7m21s 10.244.100.240 ascend-40 <none> <none>
es-jfs-prod-es-default-5 1/1 Running 0 8m44s 10.244.97.202 ascend-39 <none> <none>
es-jfs-prod-es-default-6 1/1 Running 0 10m 10.244.101.157 ascend-38 <none> <none>
es-jfs-prod-es-default-7 1/1 Running 0 11m 10.244.19.102 ascend-49 <none> <none>
es-jfs-prod-es-default-8 1/1 Running 0 13m 10.244.16.110 ascend-46 <none> <none>
es-jfs-prod-es-default-9 1/1 Running 0 14m 10.244.39.120 ascend-15 <none> <none>
es-jfs-prod-kb-75f7bbd96-6tcrn 1/1 Running 0 18h 10.244.1.164 ascend-22 <none> <none>
|
This laid one of my concerns to rest: when an Elasticsearch Pod restarts and drifts, will shard data remain on the node and cause memory usage to keep ballooning? The answer is no. The ECK Operator seems to be able to restart the Pod on its original node, and the mounted Hostpath data remains valid for the new Pod; data is only lost when the host node itself restarts.
6. Summary
AI compute nodes have a lot of idle CPU and Memory resources. Using these high-memory host nodes to deploy some short-lived, high-performance applications backed by memory storage helps improve resource utilization efficiency.
This article mainly introduced a solution for deploying Elasticsearch with memory storage via Hostpath to provide high-performance query capability. The details are as follows:
mount a memory directory onto the host- Create a Hostpath-based PVC and mount the data into the above directory
- Deploy Elasticsearch using the ECK Operator
- When Elasticsearch is updated, data is not lost, but multiple host nodes must not be restarted at the same time
- For 300+GB and 100M+ records, in a full-text search response scenario, the speed with JuiceFS storage is 18s, with SSD nodes it is 5s, and with memory nodes it is 100ms
