1. HPA VS KEDA
HPA also provides:
- Elasticity based on custom metrics
- Scale to Zero
Compared with KEDA, these are no longer disadvantages.
The real difference is that HPA can only scale using monitoring data, whereas KEDA can scale using many more data sources — queue messages, databases, Redis, and so on, including monitoring data as well.
As the project’s name — Kubernetes-based Event Driven Autoscaler (KEDA) — makes clear, KEDA is an event-based autoscaler: it emphasizes event-driven rather than monitoring-driven.
Also, KEDA and HPA are not opposites; when you use KEDA it still draws on HPA’s capabilities and creates HPA objects.
2. Deploying KEDA
| KEDA Version | Supported Kubernetes version |
|---|---|
| 2.10 | v1.24 - v1.26 |
| 2.8 | v1.17 - v1.25 |
Since the KEDA community hosts its images on ghcr.io, a copy has been mirrored to docker.io for easier use in China. See reference [1].
The test cluster version is v1.21.4, with KEDA 2.8 installed.
| |
Check whether the Pods are healthy
| |
keda-operator handles KEDA’s built-in objects and HPA objects; keda-metrics-apiserver provides the external type metrics for HPA, achieving elasticity through HPA.
3. Configuring a ScaledObject
- Create the application
| |
- Create a Service, exposed on port 30000
Metrics are exposed on port 30001 for testing convenience; if you do not need it, you can leave it unexposed.
| |
- Create the ScaledObject object
The ScaledObject is KEDA’s core object; it defines the scaling target, the triggers, the scaling policy, and so on. ScaledJob is similar to ScaledObject, except that its target is a Job.
| |
Where:
- scaleTargetRef specifies the scaling target
- pollingInterval specifies the trigger’s polling interval; the Prometheus metric sampling interval is 15s, so it is set to 15s here
- cooldownPeriod is the cooling-off time for replicas going from 1 to 0; KEDA does not target only long-running services — Scale to Zero is one of KEDA’s features too
- minReplicaCount is the minimum number of replicas
- maxReplicaCount is the maximum number of replicas
triggers specifies the data sources that trigger scaling. A Prometheus trigger is used here, and its parameters are:
- serverAddress: the Prometheus server address
- metricName: the metric name
- threshold: the threshold
- query: the Prometheus query expression
Pod replicas = current Pod replicas * (query/threshold). Here it means setting the number of Pods on the basis that each Pod handles 5 QPS.
4. Testing the Application’s Scaling Behavior
4.1 Preparing Monitoring Data
Monitoring first. Get the monitoring data visible before running the load test.
- QPS
As the monitoring values below show, the QPS statistics carry a certain amount of error.
sum (irate(nginx_server_requests{code="total", host="*"}[1m]))/60
- Pod Num
max (sum by(instance)(kube_deployment_status_replicas{deployment=~"nginx-deployment"}))
4.2 Load-Testing the Application
Here the wrk tool is used to load-test the application. The test command is:
| |
The -t1 -c10 -d120s parameters mean 1 thread, 10 connections, sustained for 120s.
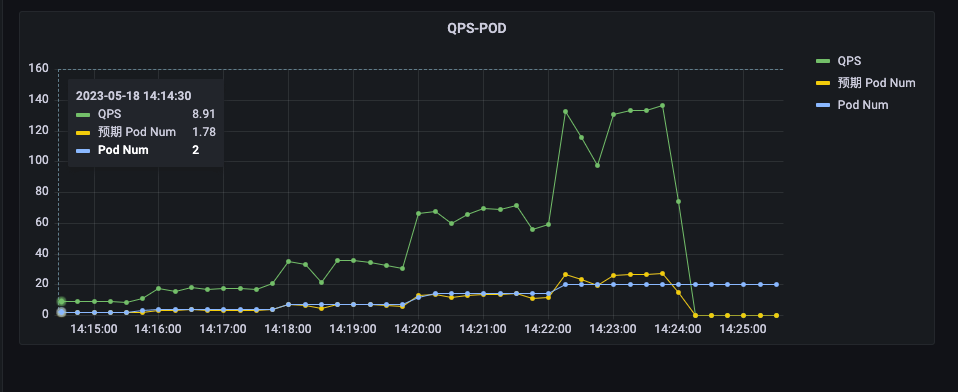
The test data is as follows:
| WRK QPS | VTS QPS | Pod Num |
|---|---|---|
| 10 | 8.9 | 2 |
| 20 | 16.8 | 4 |
| 40 | 35.5 | 7 |
| 80 | 69.6 | 14 |
| 160 | 133 | 20 |
VTS QPS / Pod Num is approximately 5, matching expectations.
Because maxReplicaCount is set to 20, when VTS QPS reaches 133 the Pod count hits its ceiling at 20 replicas.
The Pods scale down, but the Pod count does not drop to 0
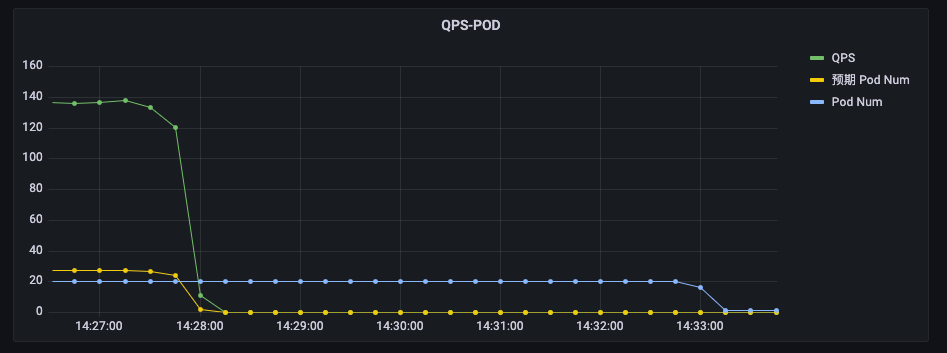
There are a few questions here:
- Why is scaling Pods down so slow
- Why does the Pod count not drop to 0
See the optimization below.
5. Optimizing the Configuration
5.1 Fast Scale-Up, Delayed Scale-Down
When a metric reaches the threshold, we want to add replicas quickly without a long wait.
When a metric falls below the threshold, we want to delay scaling replicas down, so that metric jitter does not cause the replica count to jitter along with it.
| |
The advanced parameters include:
- stabilizationWindowSeconds: the metric stabilization time, that is, how long the metric must stay at the threshold before scaling is triggered
- scaleUp: the scale-up policy
- scaleDown: the scale-down policy
- policies: the list of policies; periodSeconds is how often the policy runs, and value is how many Pods are added or removed each time the policy runs
What this means: on scale-up, 15s of sustained condition triggers scaling, adding 5 Pods every 15s; on scale-down, 60s of sustained condition triggers scaling, removing 5 Pods every 15s.
The final result is as follows:
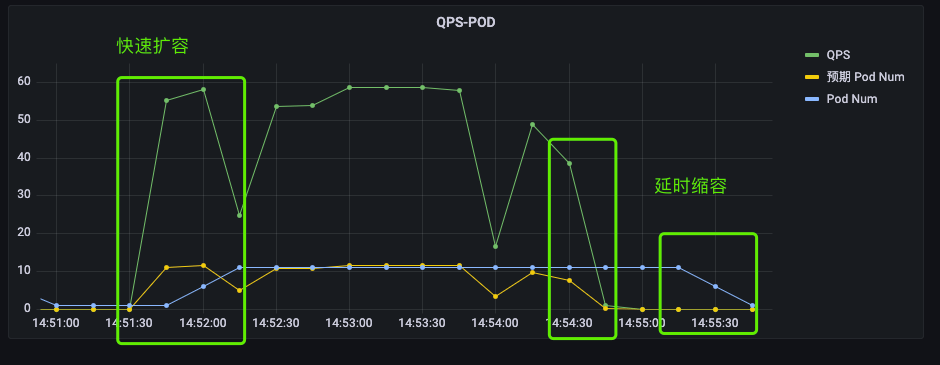
On scale-up, the metric and the Pod count increase together; on scale-down, the metric drops first, and only then does the Pod count drop.
5.2 Scale to Zero
Although we set minReplicaCount to 0, the monitoring data shows the Pod count did not drop to 0.
This comes down to the possible error in the metric. For a monitoring system, availability takes priority over consistency and accuracy — a certain amount of error is tolerated.
As the figure below shows, with no requests the metric is still not 0, which is why the Pod count never dropped to 0.
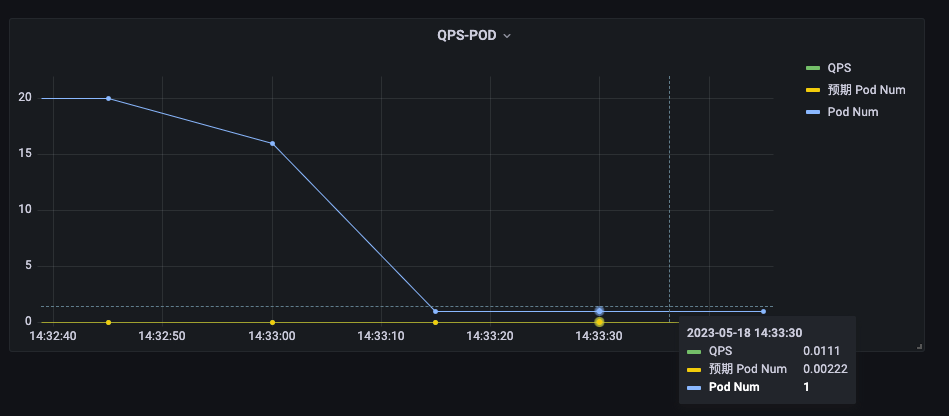
The fix is simple: just subtract the error value from the metric.
sum (irate(nginx_server_requests{code="total", host="*"}[1m]))/60 - 0.1
When the metric query returns 0 or a negative number, KEDA sets the Pod count to the minReplicaCount value.
6. Summary
Recently, in production, a batch of applications needed their Kubernetes replica counts scaled according to custom metrics, so I spent some time learning KEDA. This article mainly records the process of learning about and testing KEDA. The main points are:
- Compared with HPA, KEDA supports more trigger sources
- Through the advanced parameters, the scaling policy can be tuned to achieve fast scale-up and delayed scale-down
- With Scale to Zero, the error in the metric must be taken into account
Also, KEDA manages the Deployment’s replica count automatically, and values set by hand are overwritten. The Deployment’s resourceVersion also changes. If you modify parameters such as the Deployment’s image or environment variables while scaling is in progress, the change may fail because of a resourceVersion mismatch.
