1. Aggregating Data with Query
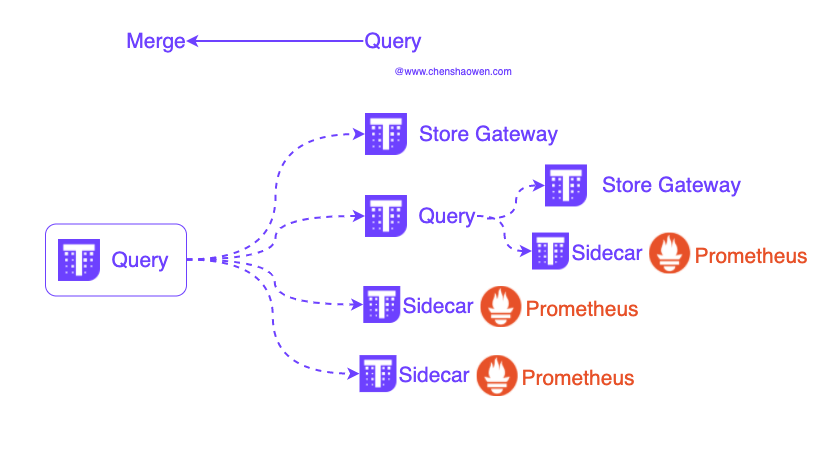
As shown above, the components that Thanos Query can connect to are:
- Thanos Store Gateway
- Thanos Query
- Thanos Receive
- Prometheus, by way of Sidecar
By cascading Thanos Queries, we can perform correlated queries across components and build an extremely large monitoring system. This also means that every connected component should provide a sufficiently fast Prometheus API. The response time of the whole interface depends on the response time of the slowest component.
Of course, you can also provide different levels of query data sources at different tiers. As shown below:
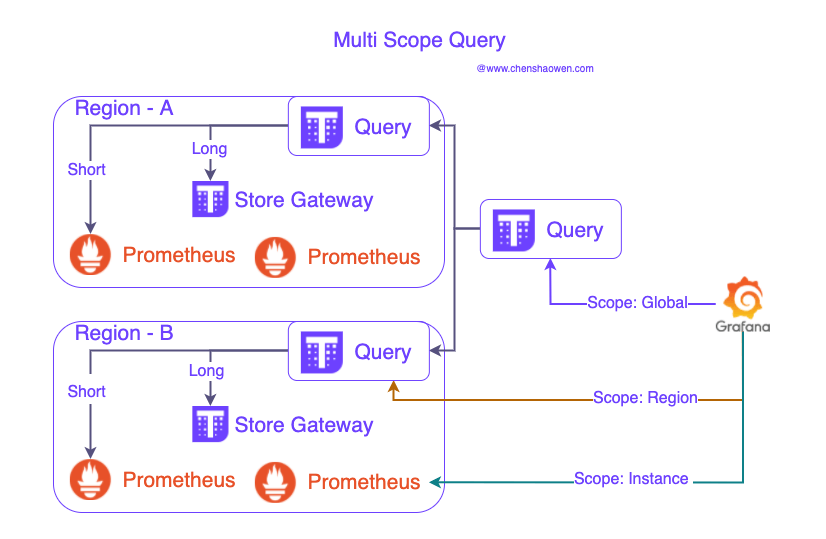
Query interfaces can be provided at the global, regional, and instance levels.
2. Splitting Metric Data and Managing Its Lifecycle
Thanos trades storage space for compute time and memory to speed up long-period metric queries. The Thanos Compact component merges small storage blocks into large ones. As shown below, the Compact component also provides management capabilities for storage blocks:
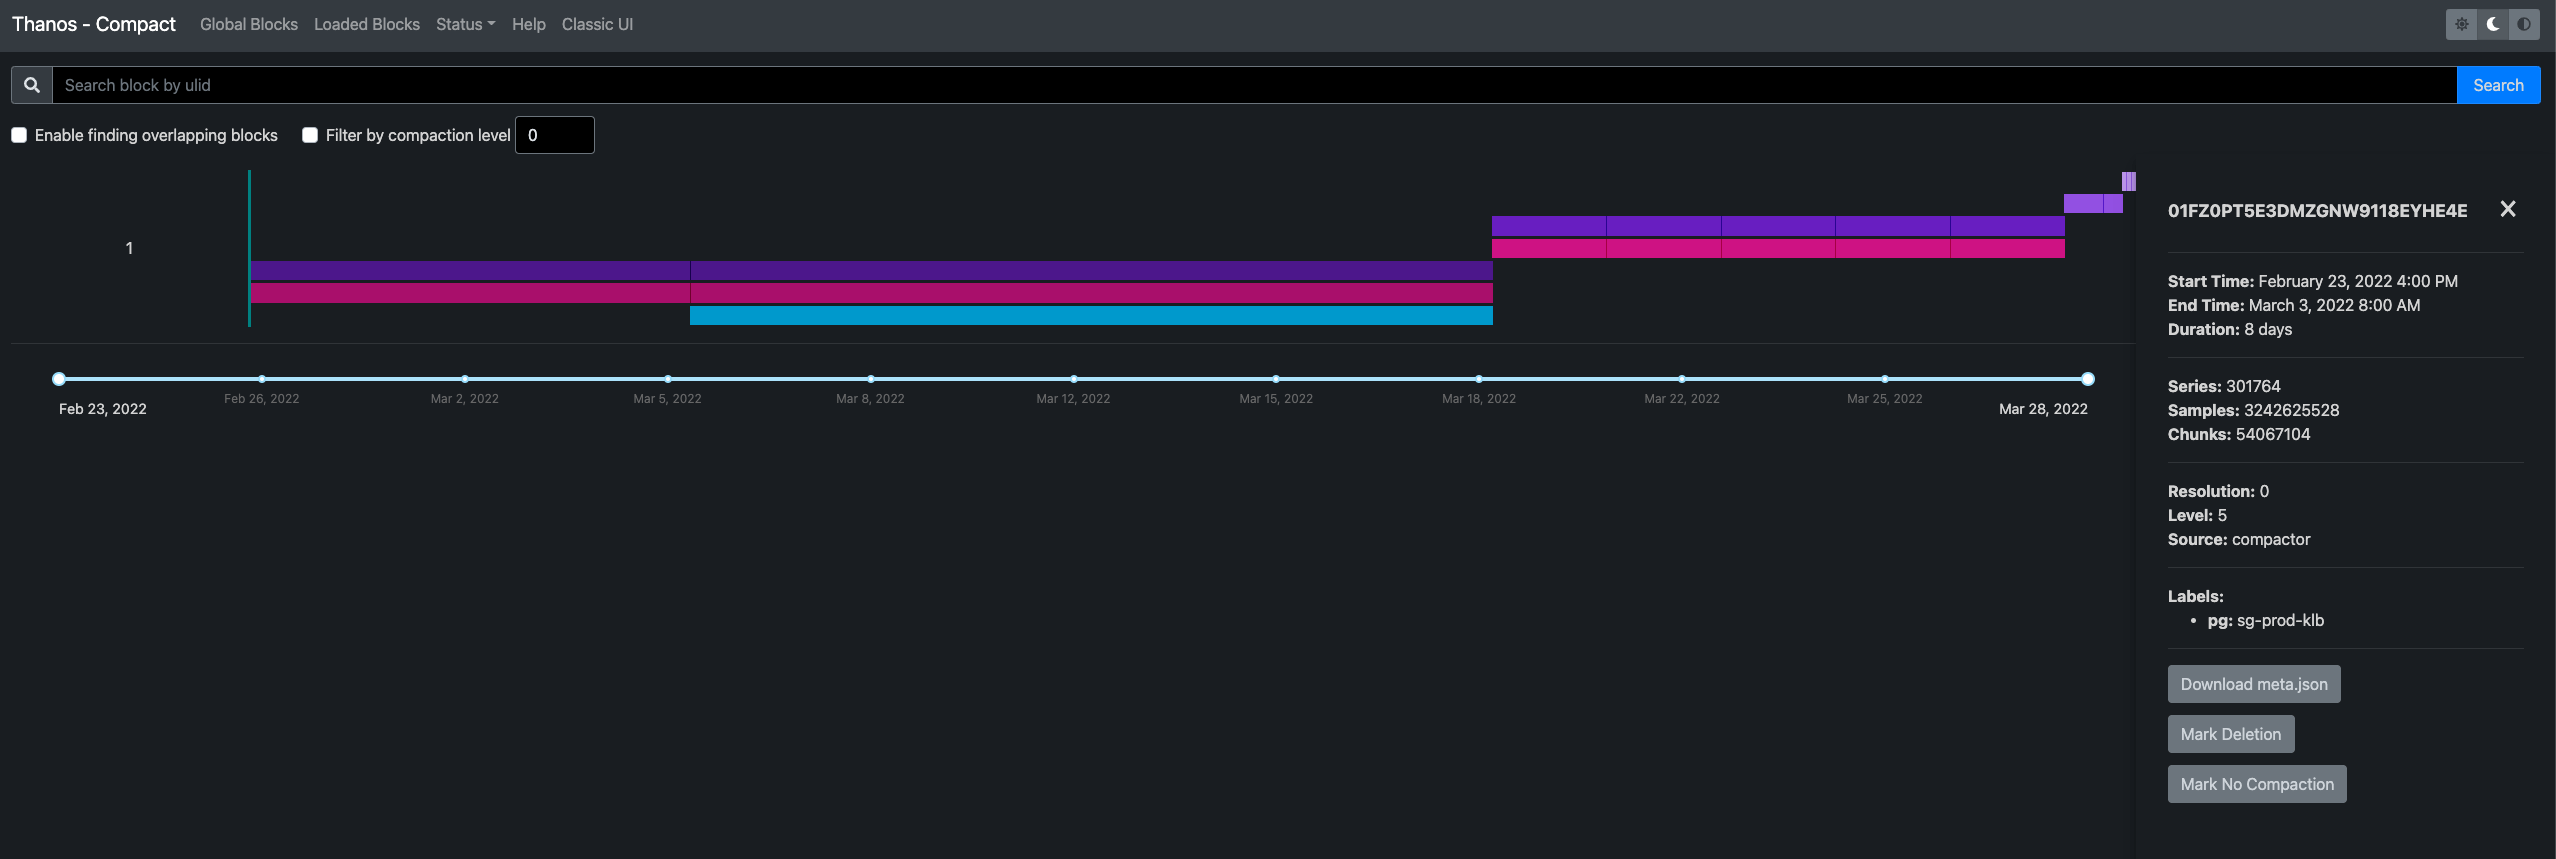
In the lower right corner, we can mark a storage block for deletion, or choose not to downsample it.
When the downsampling switch is turned on, Compact downsamples to 5 min all raw metric data older than 40 h, and downsamples to 1 h all 5 min metric data older than 10 day. As for how long the raw data, the 5 min downsampled metric data, and the 1 h downsampled metric data are kept, this is configured through the following parameters:
--retention.resolution-raw=90d, raw data is kept for the most recent 90 days--retention.resolution-5m=180d, 5-minute downsampled data is kept for 180 days--retention.resolution-1h=360d, 1-hour downsampled data is kept for 360 days; 0d means permanent storage
This means we can see 1 h downsampled series for a whole year, but cannot zoom in locally to any detail finer than 1 h for data older than half a year; and we can see 5 min downsampled series for half a year, but cannot zoom in locally to any detail finer than 5 min for data older than three months.
To avoid conflicts, only one Compact is allowed to run against a single Bucket. And the Compact parameters directly determine the lifecycle of a storage Bucket.
When the business scale is large, it is impossible to store all monitoring data in a single Bucket, even if the object storage performance is already very good. We still need to split data storage, as shown below:
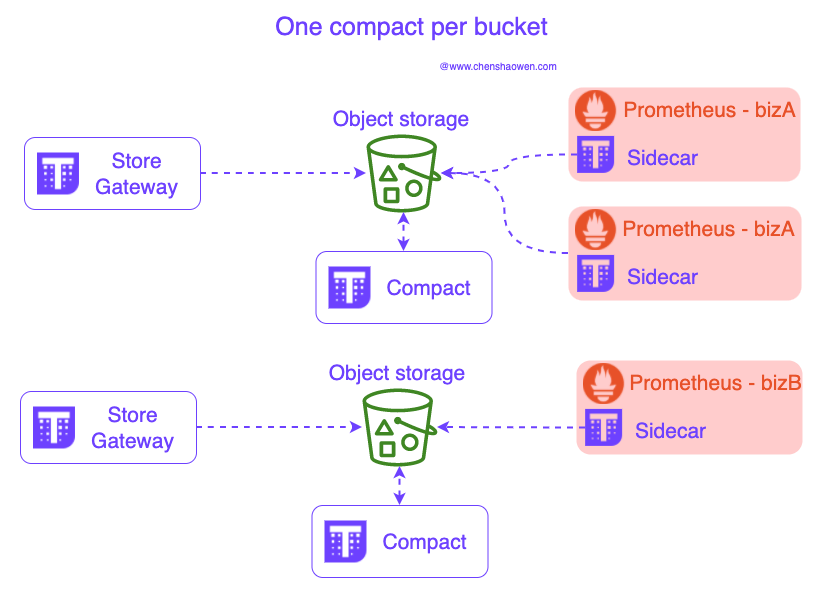
Each Store Gateway needs to be configured with a Bucket, and a Bucket allows only one Compact. Buckets can be divided along the following dimensions:
- Billing method
- Region
- Business unit
- Infrastructure tier
- Horizontal splitting of a single metric
3. Setting the Prometheus Retention Period to 6 h
When first using Thanos, you run into two confusing things:
- Why is there no data for the last 2 h?
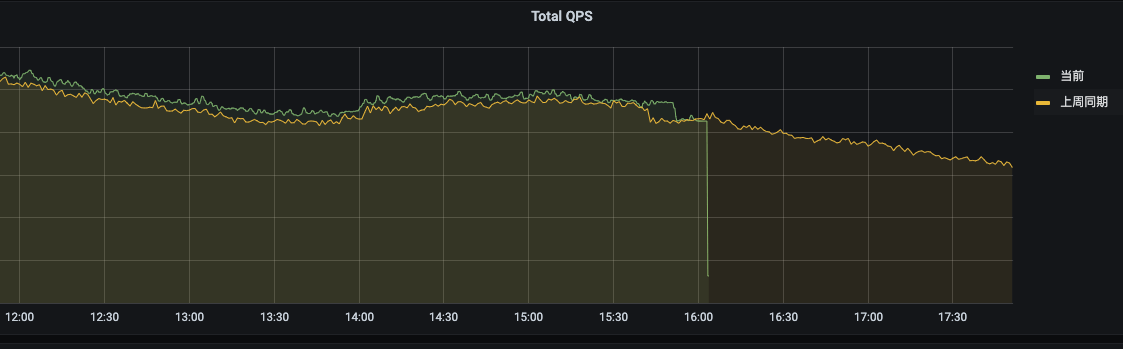
Because the Prometheus query source was not configured.
- Why hasn’t the query speed improved?
Because the retention period of the Prometheus query source is too long.
The answer is in the figure below:
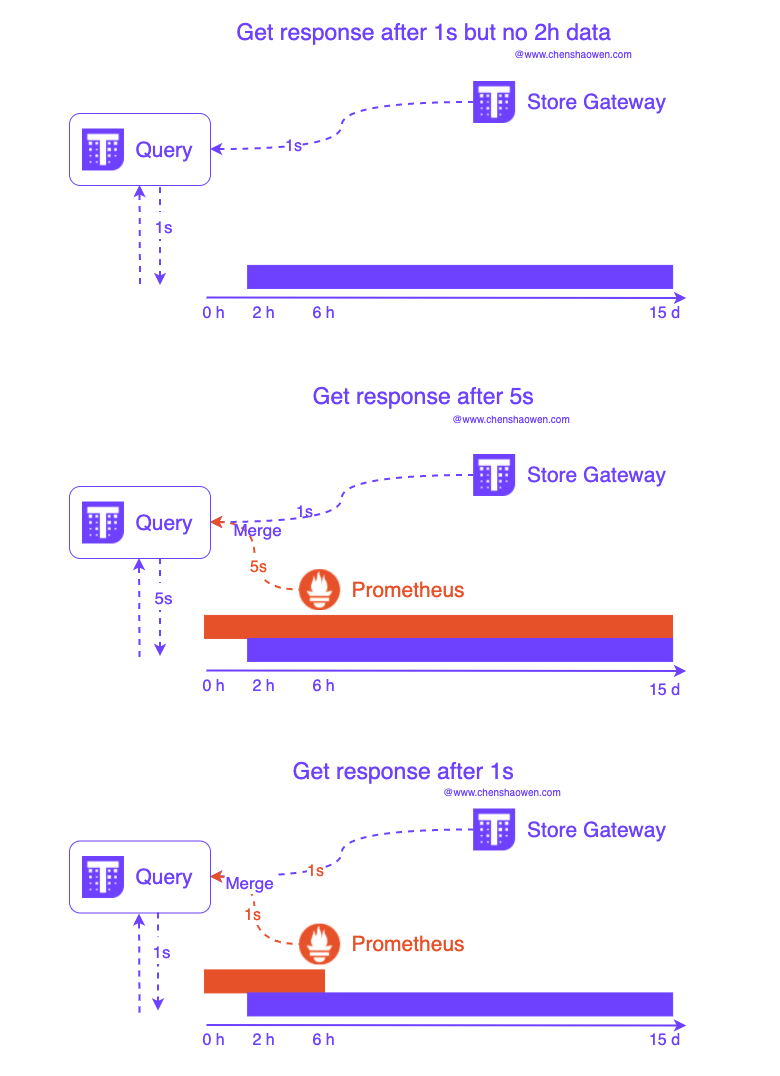
- In Sidecar mode, data is uploaded once every 2 h, so if you only configure the Store Gateway address, the Query component will only be able to query data older than 2 h.
- When the retention time set on Prometheus is too long, then when Query queries long-period data it cannot effectively use Store Gateway to query downsampled data, and instead has to wait for Prometheus to also return results, so query performance cannot be improved.
- Only when the Prometheus source is connected to the Query component as a Sidecar gRPC and set to a short period can you feel the query performance improvement that Thanos brings.
Usually, setting Prometheus’s --storage.tsdb.retention.time parameter to 3 times the Sidecar’s block upload period, that is 3 * 2 h = 6 h, is enough.
4. Tuning Store Gateway to Speed Up Queries
The Thanos Store component provides a query interface to Thanos Query based on metric data in object storage. The Store component offers some parameters that can optimize queries.
4.1 Setting Up Caching
--index-cache-size=250MB uses an in-memory cache by default to speed up queries. Other optional caches include memcached and redis.
4.2 Setting the Query Range
The --min-time and --max-time parameters specify the data range the current Store can query.
You can specify it directly per the RFC3339 spec as -min-time=2018-01-01T00:00:00Z,--max-time=2019-01-01T23:59:59Z, or specify a relative time --min-time=-6w,--max-time=-2w to allow only querying data from more than 2 weeks ago but no more than 6 weeks ago.
This approach not only controls the query range, but also speeds up the return of interface data and filters out unnecessary query results.
Another optimization direction is using the Query Frontend component, which likewise leverages caching to speed up query responses.
5 Redesigning the Label System
After using Thanos Query to merge multiple Prometheus data sources, the first problem you encounter is how to distinguish data from different sources. If external_labels are not planned in advance, metric data from various environments and regions will be mixed together and become completely unusable.
As shown below, some necessary Labels need to be set in every Prometheus instance to distinguish data from different Prometheus instances.
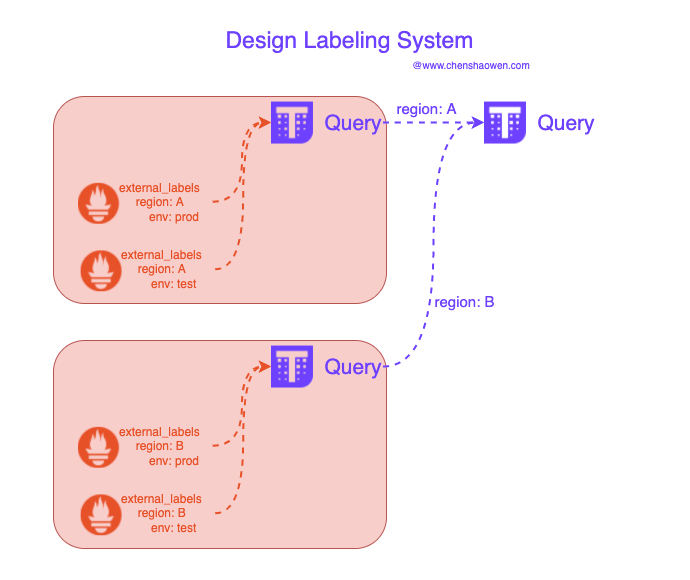
On the other hand, when querying and using monitoring metric data, these labels also need to be carried. This part of the workload shows up in modifying Grafana dashboards and adjusting query API parameters.
6. Summary
This post is mainly some thoughts and a summary from using Thanos in a production environment. The goal when first using Thanos was to be able to deploy it; after deploying it online, the goal was to be able to put it to use; and the final goal is to be able to anticipate some future problems and solve them in advance.
