
1. Debugging Until You Want to Quit
GitHub Actions is the continuous integration service GitHub launched in October 2018. For open-source projects it offers unlimited free build time, and it supports Linux, MacOs, and Windows systems, which makes it very appealing.
But a recent experience changed my view. I submitted a commit, improvement: build and ci, to a colleague’s repository, to improve its continuous build setup. As shown below:
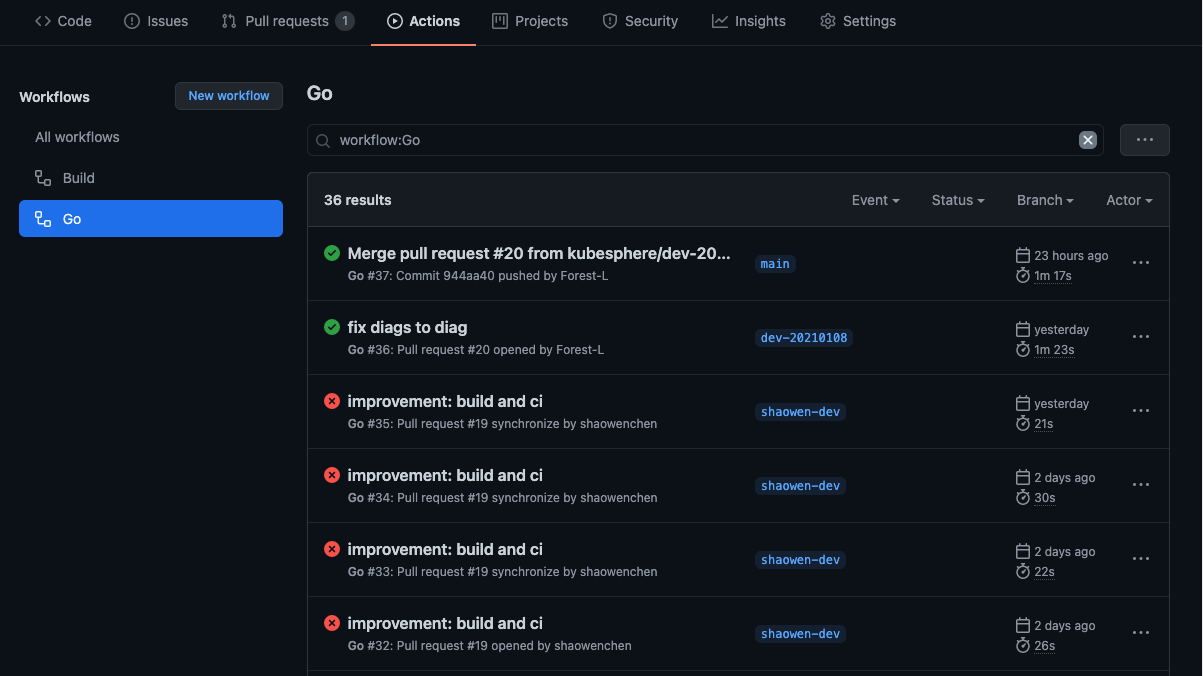
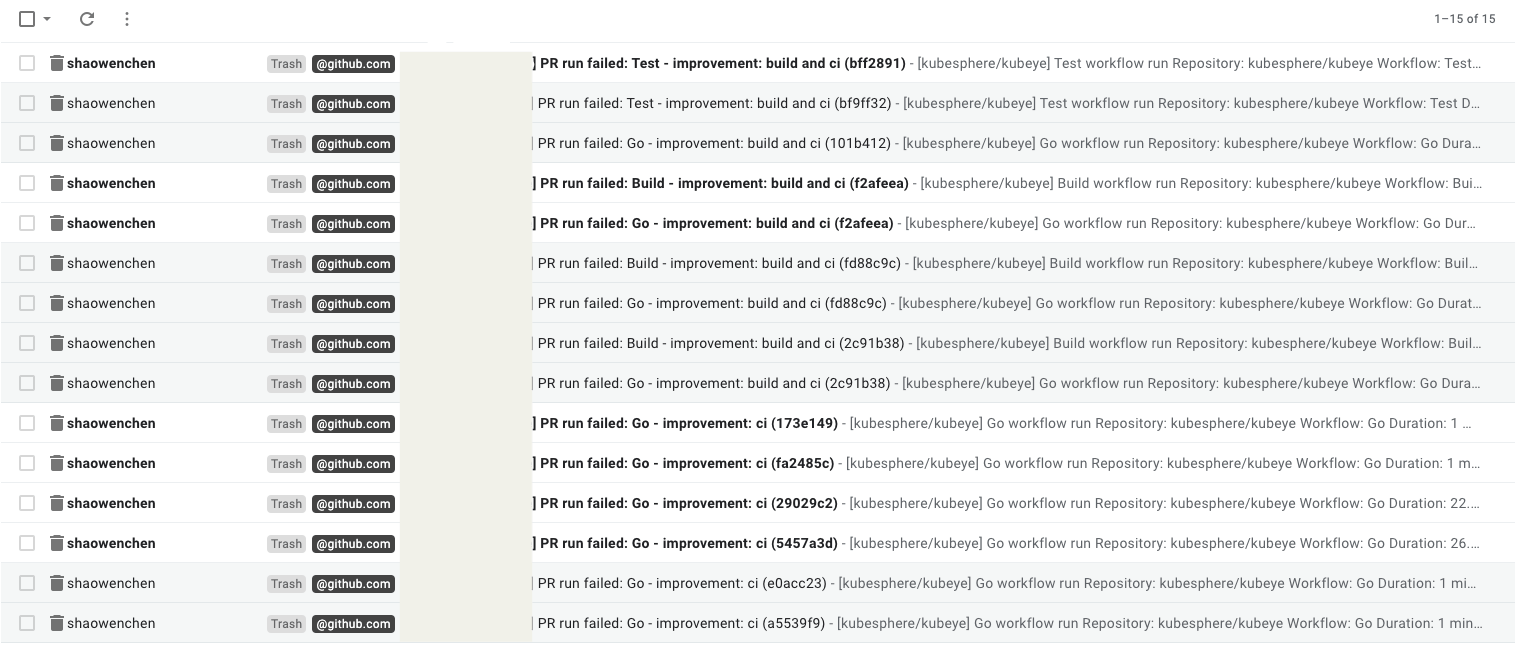
These are just a few entries from the debugging process. It passed locally, but as soon as I added it to the workflows it failed. I spent more than a day on it, submitting no fewer than dozens of commits for testing. This was a private repository, so I had to follow the Merge Requests development process. That in itself was fine — the problem was that my boss was watching the repository. Every failed build sent him a notification email, and it happened right at the end of the year. Tears ~~~
2. The Birth of debugger-action
That weekend I happened to see that PingCap was running a Hackathon, a chance to focus on completing one feature in a short time. Inspiration struck, and I spent the weekend using GitHub Actions to solve the problem of debugging until you want to quit.
I skimmed TypeScript syntax, leaned on a bit of my earlier SaaS full-stack development background and the power of Google search, and got it done.
Let’s look together at how to debug GitHub Actions. Below is a Go workflows environment:
| |
Once it is running, the Runner is held for 30 minutes, and the developer can log in to the Runner remotely over ssh to run commands and debug.
| |
Enter the root password: root
That gets you into the Runner’s execution environment. debugger-actions currently supports Linux and MacOS build environments.
3. Configuring and Using debugger-action
3.1 Setting Up the Frp Server
See a post I wrote earlier, Using frp to Publish a Local Service to the Public Network, which includes a one-click install script.
A successful install yields a configuration:
==============================================
You Server IP      : x.x.x.x
Bind port          : 5443
KCP support        : true
vhost http port    : 80
vhost https port   : 443
Dashboard port     : 6443
token              : x
tcp_mux            : true
Max Pool count     : 200
Log level          : info
Log max days       : 30
Log file           : enable
==============================================
If you don’t have a server, you can also use the test Frp Server I provide in the project issues, https://github.com/shaowenchen/debugger-action/issues/3 .
3.2 Configuring Secrets
On the Settings page, under Secrets, add three secrets, FRP_SERVER_ADDR, FRP_SERVER_PORT, FRP_TOKEN, with values taken from the previous step. As shown below:
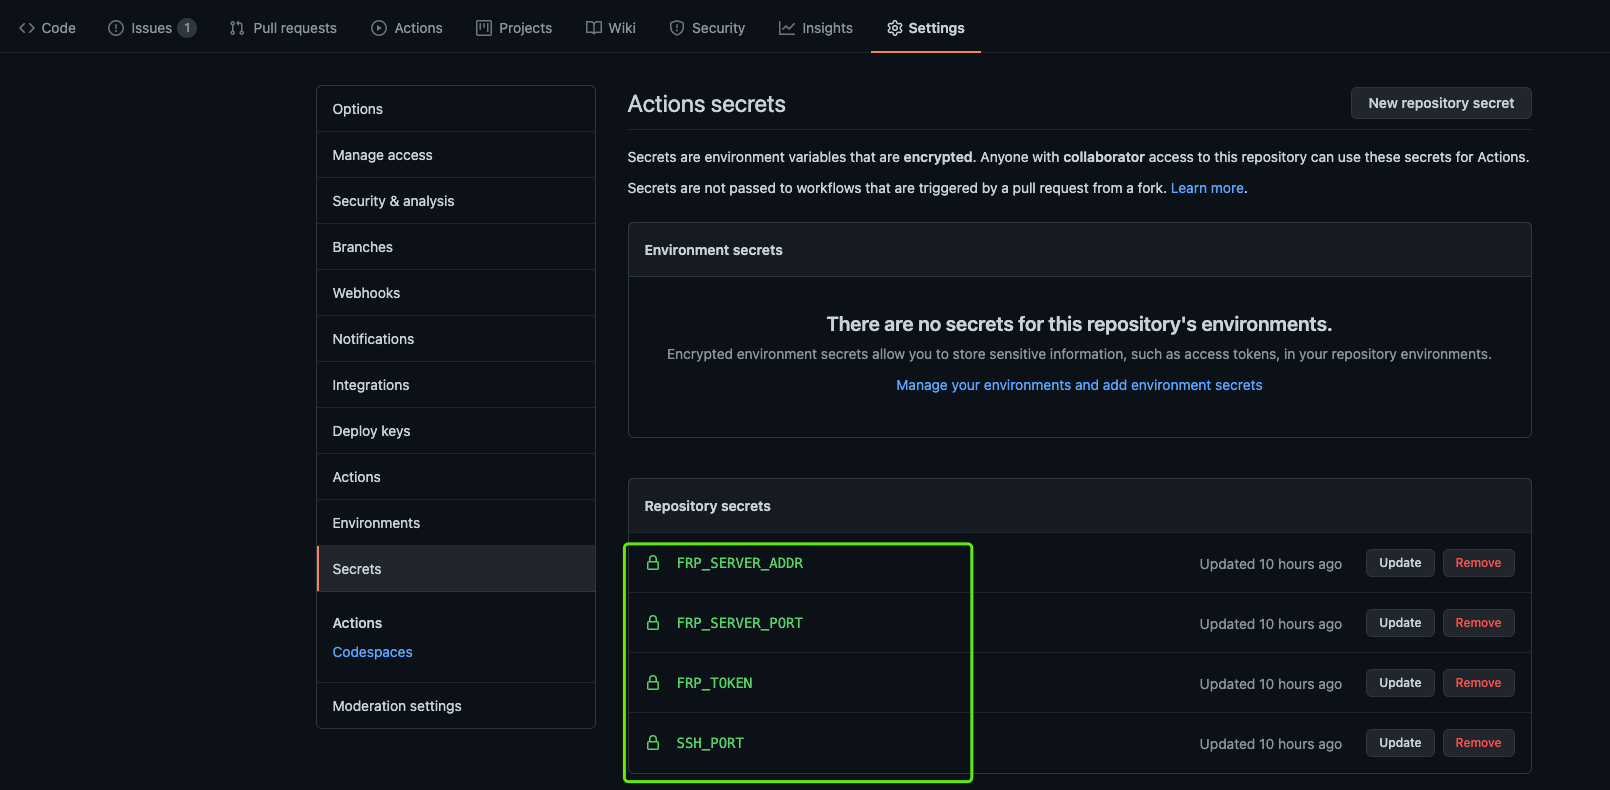
| Secrets | Corresponding Frp value |
|---|---|
FRP_SERVER_ADDR | You Server IP |
FRP_SERVER_PORT | Bind port |
FRP_TOKEN | token |
SSH_PORT can be set to anything, but it must not be the same across different Workflows. If SSH_PORT is the same, the Frp Client will fail to start. You can of course use a fixed value, it is just less secure.
3.3 Adding debugger-action
Add the following yaml snippet wherever you need to Debug in your Workflows.
| |
Here timeout-minutes sets how long you need to Debug for. In GitHub Actions, the maximum execution time allowed for each Job is 6 hours.
4. Trying It Out
Use the ssh command, root/root (account/password), to log in to the Runner.
| |
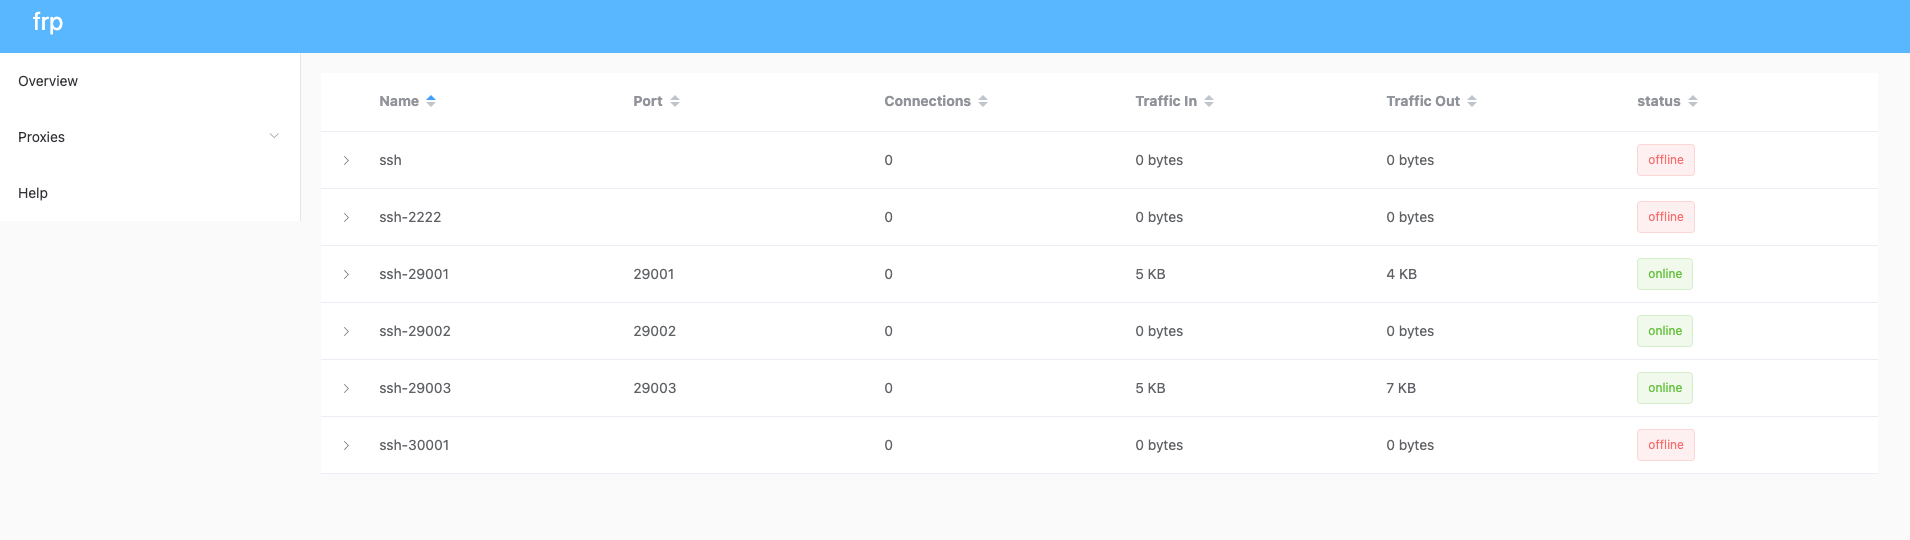
You can also see the connection in the Frp Dashboard.
5. Some Test Cases
5.1 A buildx Build Environment
| |
Command-line test:
| |
5.2 A Kind Cluster
| |
Command-line test:
| |
5.3 A MacOS Environment
| |
Command-line test:
| |
