This page looks best with JavaScript enabled

debugger-action Updated to v2 with ngrok Support

 ·  ☕ 2 min read

1. What Is Ngrok

Ngrok is an intranet penetration tool that can publish services on the internal network to the public internet. The figure below illustrates its function well:
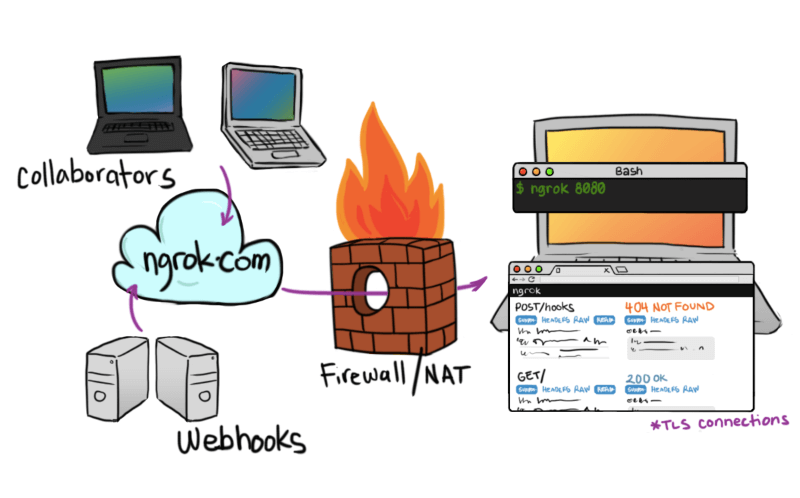
Compared with a similar tool like Frp (which requires running both a Server and a Client), Ngrok turns intranet penetration into a service. You only need to register an account on Ngrok, obtain an Authtoken, and start the Client to expose a public address for your local service.

It is very simple to use, in three steps:

  1. Unzip the Ngrok file
1
unzip /path/to/ngrok.zip
  1. Authorize
1
./ngrok authtoken xxxxxxxxxx
  1. Expose the service
1
./ngrok tcp 22

This gives you an address that can be accessed directly from the public internet, for example: 4.tcp.ngrok.io:18848

2. What Is debugger-action

In the previous article 《GitHub Actions 在线调试工具:debugger-action》, I introduced a debugging tool for GitHub Actions that lets developers keep the Runner online so they can log in remotely over SSH to debug.

In shaowenchen/debugger-actions@v1, debugging relies on the Frp Server service, as shown below:

1
2
3
4
5
6
7
8
9
- uses: shaowenchen/debugger-action@v1
  name: debugger
  timeout-minutes: 30
  continue-on-error: true
  with:
    frp_server_addr: ${{ secrets.FRP_SERVER_ADDR }}
    frp_server_port: ${{ secrets.FRP_SERVER_PORT }}
    frp_token: ${{ secrets.FRP_TOKEN }}
    ssh_port: ${{ secrets.SSH_PORT }}

This is not friendly enough for developers. After learning that Ngrok offers a free penetration service, I added Ngrok support in shaowenchen/debugger-actions@v2. v2 still supports Frp as well.

Now let’s see how to use Ngrok for GitHub Actions debugging.

3. Using Ngrok for Debugging with debugger-action

3.1 Log in to the Ngrok Website and Get the Authtoken

Visit the Ngrok website, https://dashboard.ngrok.com/, and log in with your GitHub or Google account.

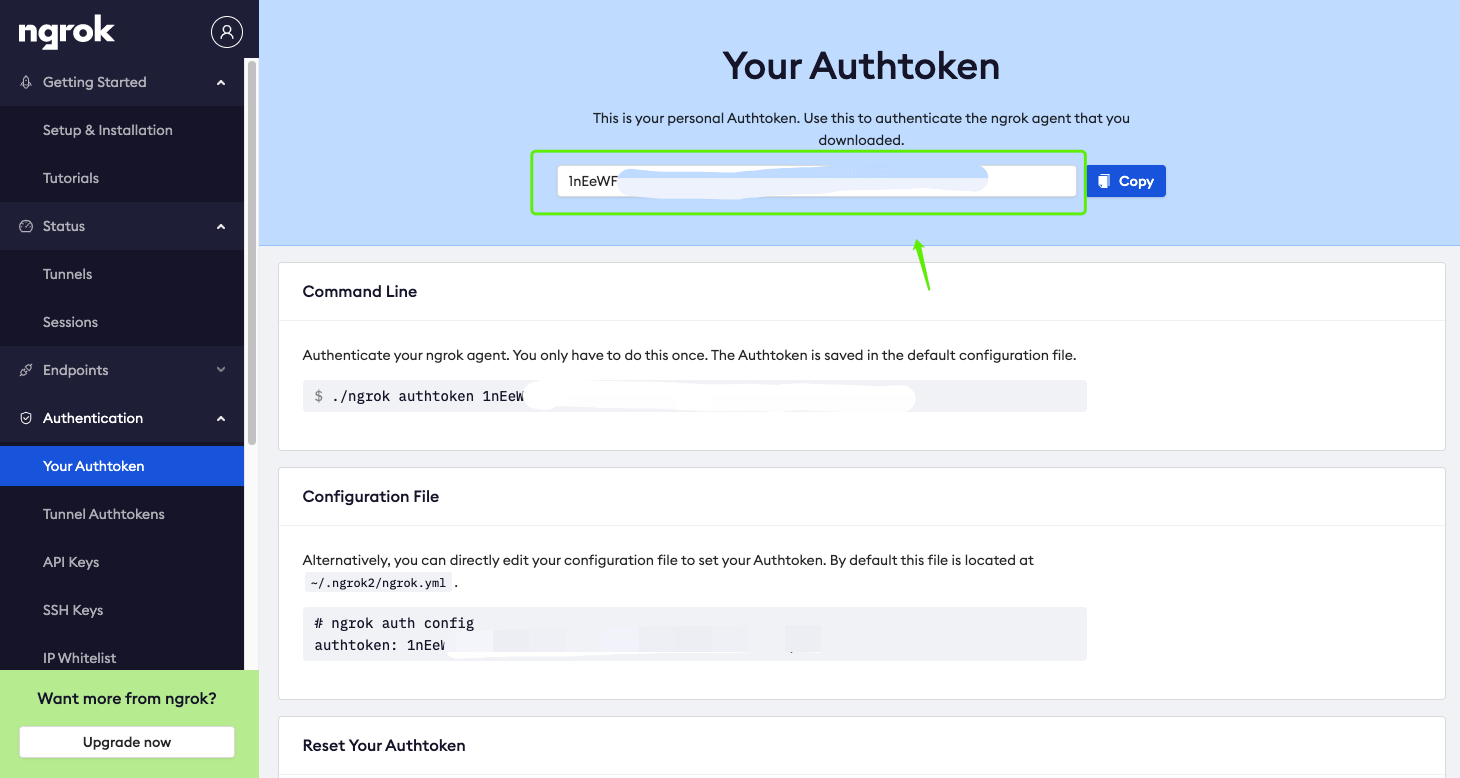
Go to the Authentication page and find your Authtoken, as shown below:
3.2 Configure Secrets in the GitHub Project

On the project’s Settings page, add a Secret, as shown below:
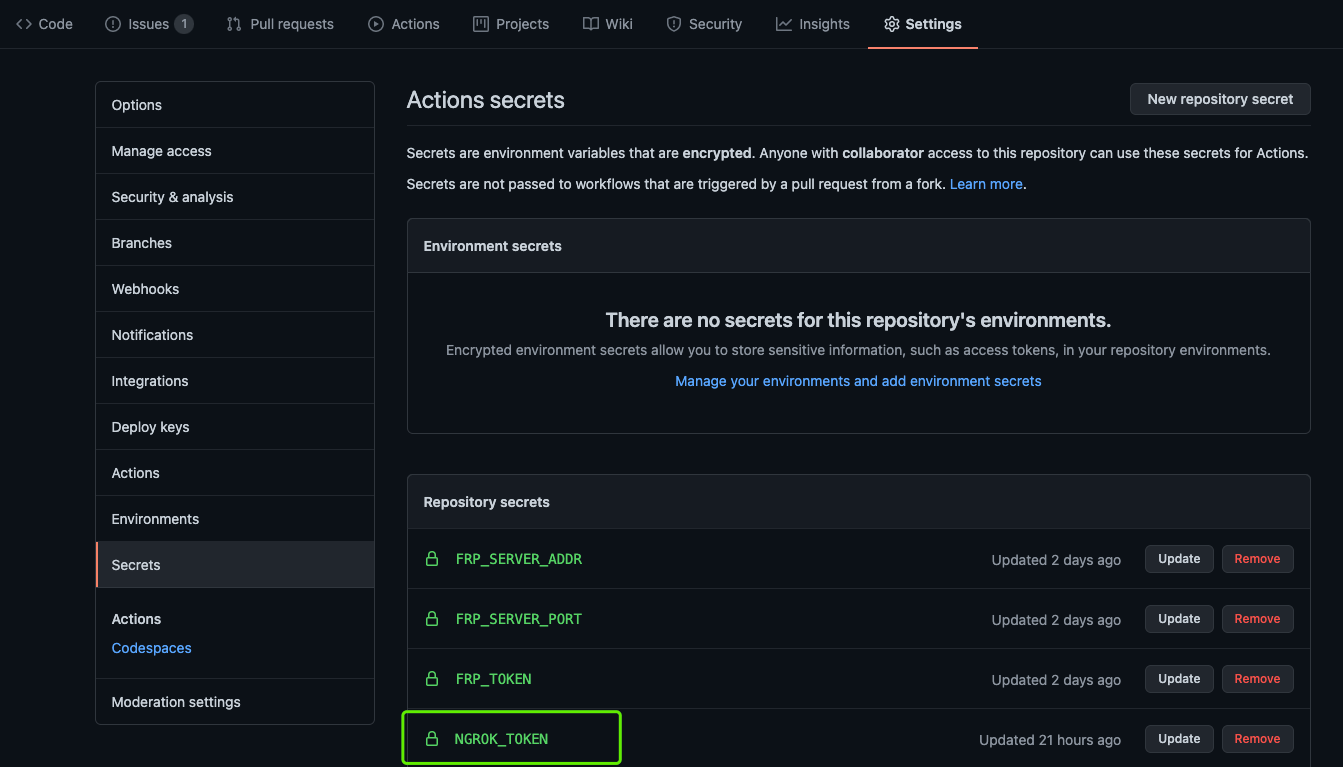
Set NGROK_TOKEN to the Authtoken obtained in the previous step.

3.3 Add debugger-action to the Project

In the Workflow where you need breakpoint debugging, add the following debugger-actions snippet:

1
2
3
4
5
6
- uses: shaowenchen/debugger-action@v2
  name: debugger
  timeout-minutes: 30
  continue-on-error: true
  with:
    ngrok_token: ${{ secrets.NGROK_TOKEN }}

Here is a complete example for a Kind environment:

 1
 2
 3
 4
 5
 6
 7
 8
 9
10
11
12
13
14
15
16
name: example-ngrok-kind-v2
on:
  workflow_dispatch:

jobs:
  example-ngrok-kind-v2:
    runs-on: ubuntu-latest
    steps:
      - name: Creating kind cluster
        uses: helm/kind-action@v1.0.0-rc.1
      - uses: shaowenchen/debugger-action@v2
        name: debugger
        timeout-minutes: 30
        continue-on-error: true
        with:
          ngrok_token: ${{ secrets.NGROK_TOKEN }}

3.4 Log in Remotely to Debug

Since the previous step uses workflow_dispatch, you need to trigger the workflow manually.
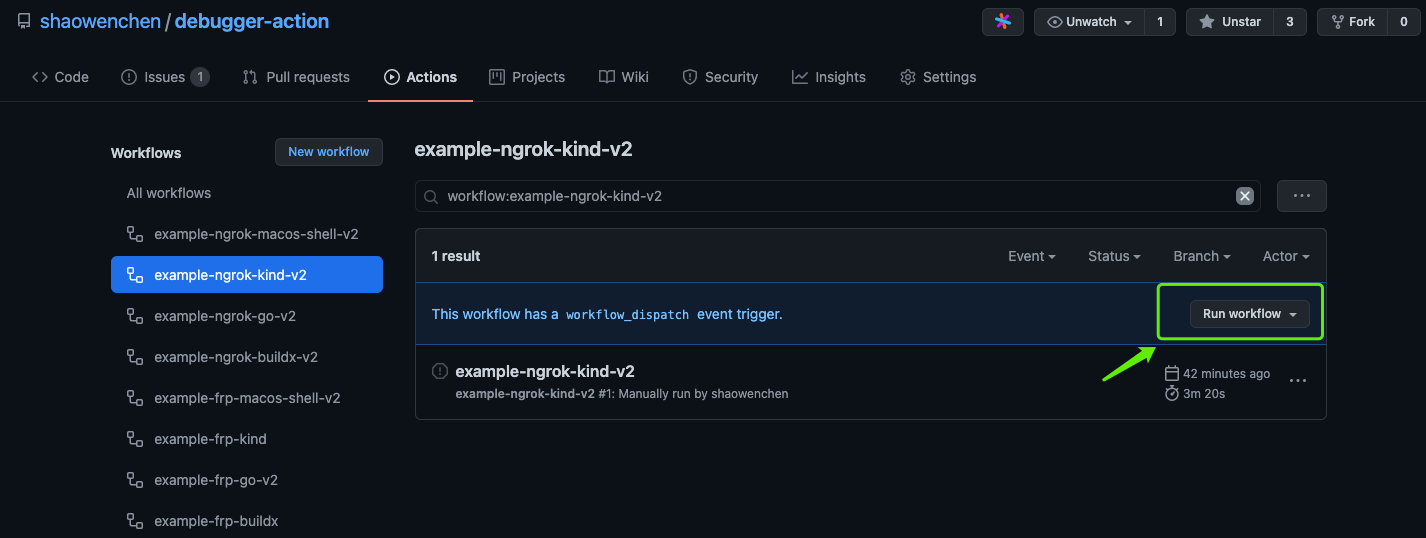
In the GitHub Actions logs you can find the access address output by Ngrok, as shown below:
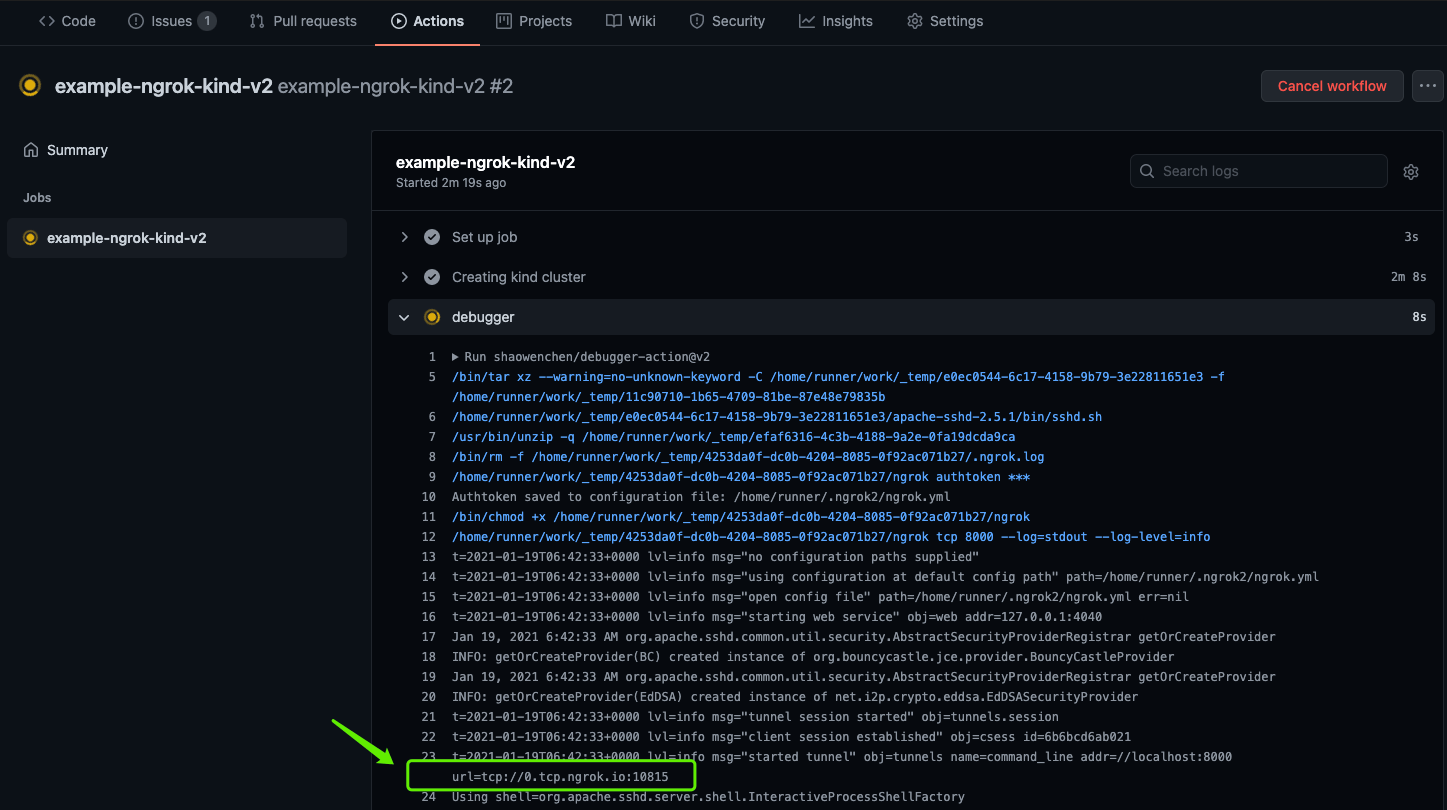
Log in using SSH:

1
ssh root@0.tcp.ngrok.io -p 10815

Enter the password: root

Then you can debug happily on the Runner.

 1
 2
 3
 4
 5
 6
 7
 8
 9
10
11
12
kubectl get pod -A

NAMESPACE            NAME                                                  READY   STATUS    RESTARTS   AGE
kube-system          coredns-6955765f44-cknkh                              1/1     Running   0          2m35s
kube-system          coredns-6955765f44-crx27                              1/1     Running   0          2m35s
kube-system          etcd-chart-testing-control-plane                      1/1     Running   0          2m51s
kube-system          kindnet-l2sjw                                         1/1     Running   0          2m35s
kube-system          kube-apiserver-chart-testing-control-plane            1/1     Running   0          2m51s
kube-system          kube-controller-manager-chart-testing-control-plane   1/1     Running   0          2m51s
kube-system          kube-proxy-td9jg                                      1/1     Running   0          2m35s
kube-system          kube-scheduler-chart-testing-control-plane            1/1     Running   0          2m52s
local-path-storage   local-path-provisioner-7745554f7f-qf6n8               1/1     Running   0          2m35s

4. References


WeChat Official Account
WRITTEN BY
WeChat Official Account