1. 现象
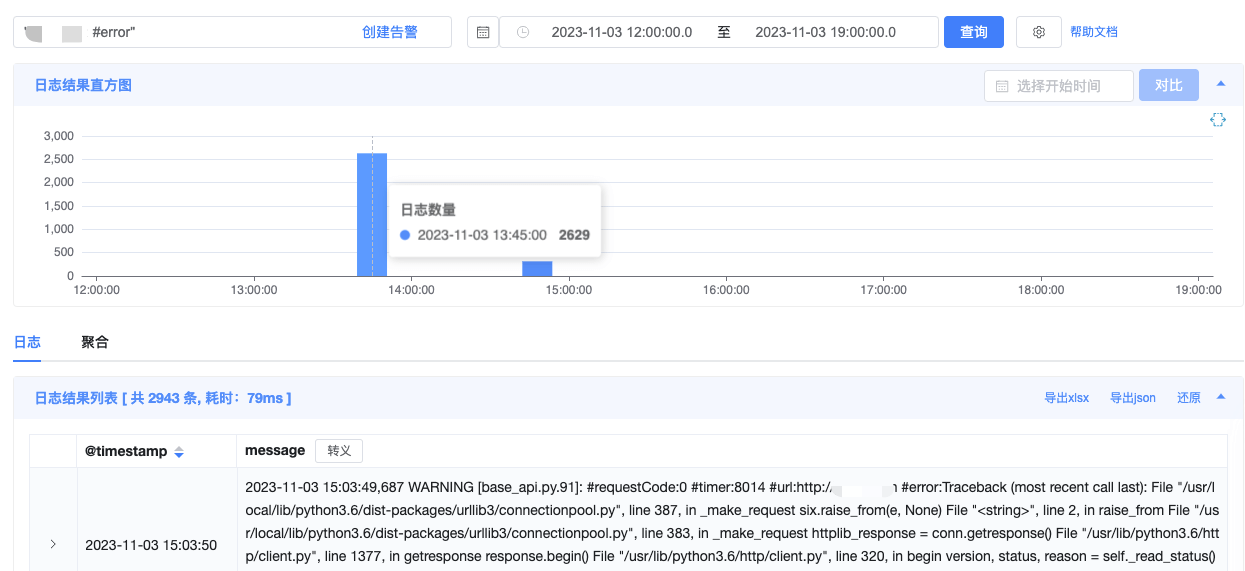
业务反馈应用 app-a 的接口慢,查看日志发现是某一个 Pod 慢,删除该 Pod 让其更换节点就好。
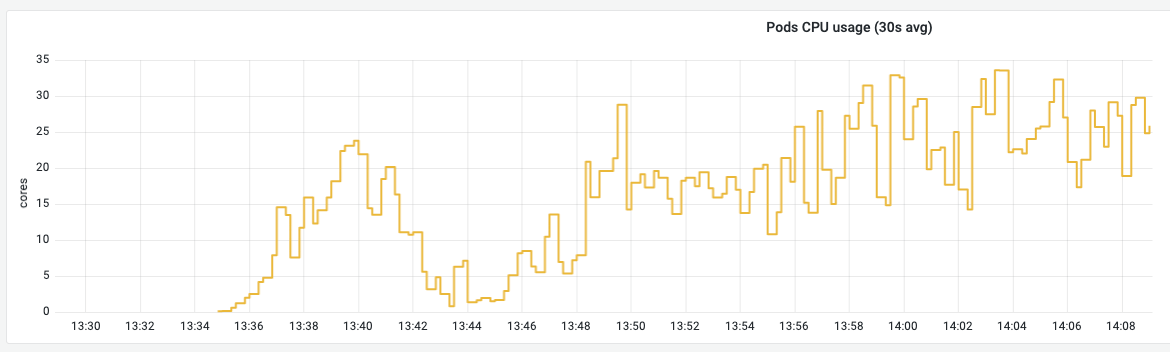
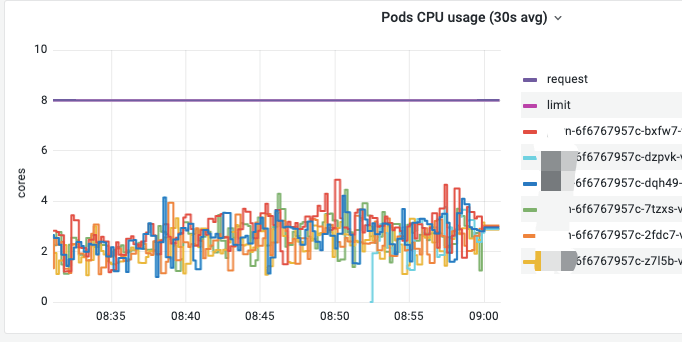
从监控指标可以看到,Pod 的 CPU 使用率确实有剧增。
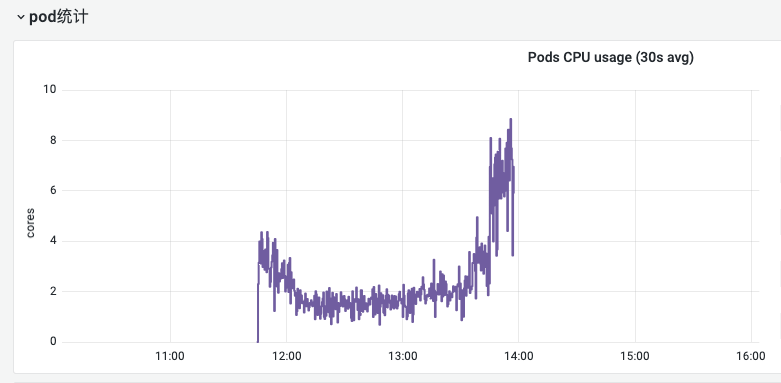
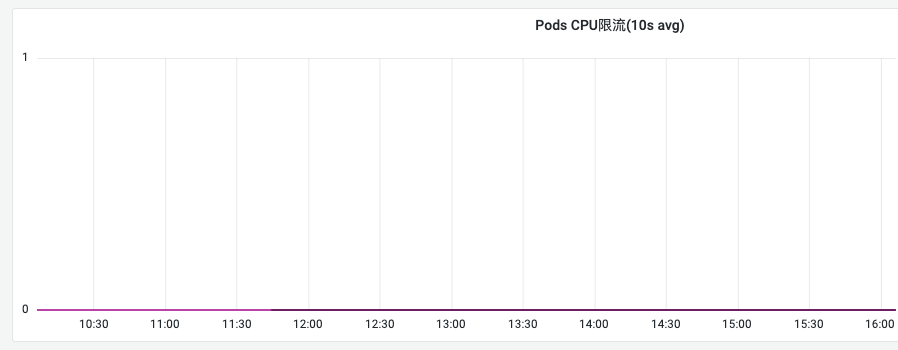
但该 Pod 没有达到 Limit 的限制,没有被限流 CPU。
接着看节点的 CPU 监控,发现节点的 CPU 使用率也有剧增。
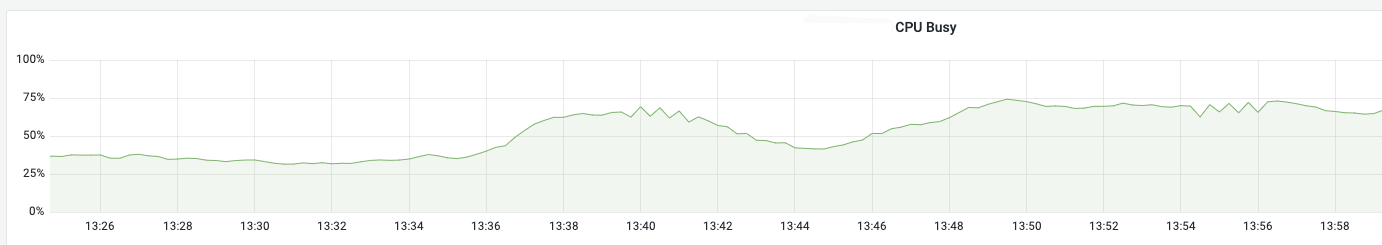
并且增加的部分是 System CPU,也就是内核态的 CPU。
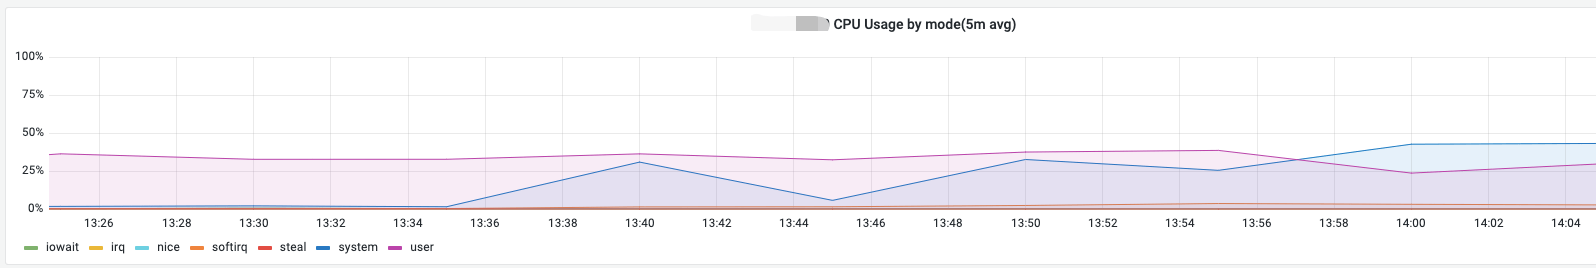
进一步,确定增加的部分是 System CPU,也就是内核态的 CPU。
使用内核态 CPU 的主要场景有网络、磁盘 IO 等。
2. 排查问题
2.1 排查磁盘 IO
iowait 高并不意味着磁盘 IO 高,iowait 高只是说明 CPU 等待 IO 的时间长,但是并不一定是因为磁盘 IO 高导致的,也可能是网络 IO 高所致。但 iowait 低则能判断出磁盘 IO 压力小。
从上面的监控可以看到 CPU 的 iowait 低,说明磁盘没有瓶颈。
另外,从监控指标可以看到,磁盘 IO 速度、IOPS 也都没有异常波动。
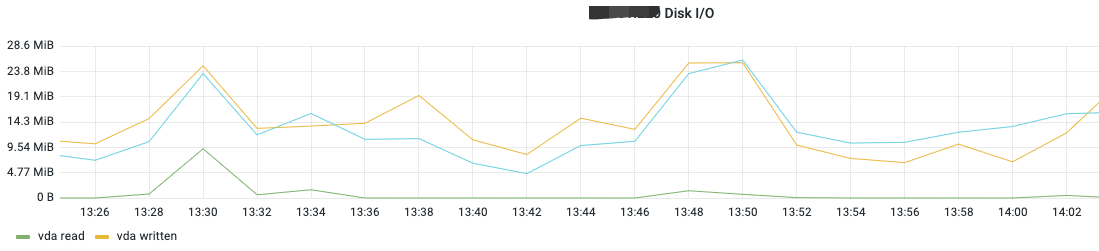
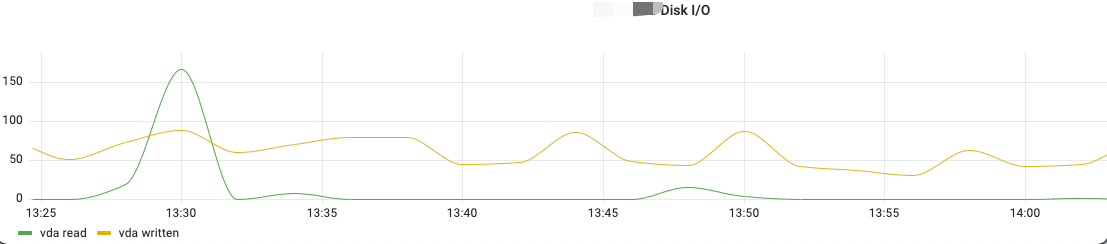
也可以结合磁盘设备平均 IO 队列数、读延迟、写延迟等指标继续确认磁盘 IO 是否有异常。
至此,基本排除了磁盘 IO 的瓶颈。
2.2 排查网络 IO
网络 IO 先看节点 Node 的进出流量,再找异常流量的 Pod。
从监控可以看到,节点的网络 IO 有异常波动,从 500 Mbps 到 800 Mbps 。
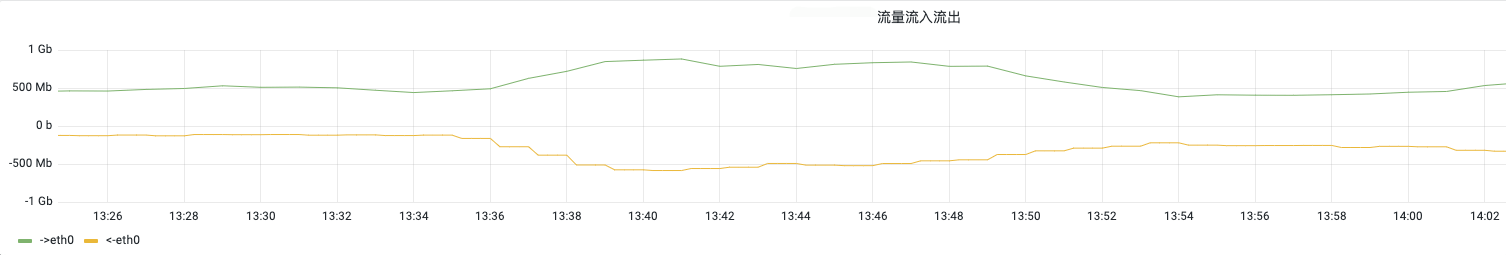
接着找到这个节点上流量异常的 Pod。
2.3 找到问题
很快,我就从监控系统中找出了这个 Pod。
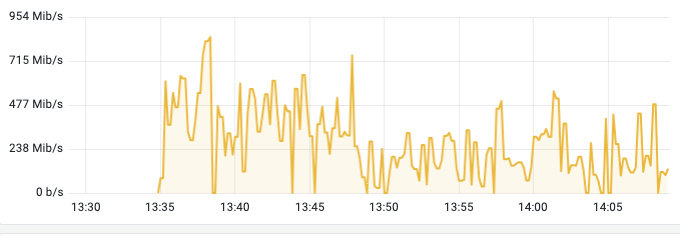
时间点上很符合,大量的网络 IO、CPU 使用剧增。
原来是应用 app-b,在 HPA 扩容调度时,恰好调度到了这个节点上,导致这个节点的网络 IO、CPU 使用剧增,影响到了延时敏感的应用 app-a,导致应用 app-a 的接口慢。
2.4 解决问题
解决办法就是利用 Pod 的反亲和性,将应用 app-a 和应用 app-b 从调度层隔离开来,不让其同时存在于一个节点。
 1
 2
 3
 4
 5
 6
 7
 8
 9
10
11
12
13
14
15
| kind: Deployment
name: app-a
spec:
spec:
restartPolicy: Always
affinity:
podAntiAffinity:
requiredDuringSchedulingIgnoredDuringExecution:
- labelSelector:
matchExpressions:
- key: app
operator: In
values:
- app-b
topologyKey: kubernetes.io/hostname
|
至此,应用 app-a 慢的情况比之前改善了很多,但还是会偶尔出现慢的情况。于是,我继续花了点时间排查。
3. 为什么 Pod CPU 没有被限流
我一度怀疑应用 app-a 的 Pod CPU 有被限流,监控指标没有反应出来而已。但排查了一段时间后,我并没有发现相关的证据。这个猜测可能是错误的。
3.1 K8s 中的 CFS 限流机制
CFS 是 Linux 内核中用来实现 CPU 带宽控制的一种机制,它可以设定一个进程组可使用的 CPU 时间的上限。
通常,CPU 使用的的计量周期为 100ms。CPU Limit 决定了每个计量周期,也就是 100ms 时间内,可以使用的 CPU 时间上限。
1 CPU 代表着 100ms 内,可以使用 1 个核心的 CPU 时间;2 CPU 代表着 100ms 内,可以使用 2 个核心的 CPU 时间。但如果是 0.5 CPU,代表着 100ms 内,就不是 0.5 个核心的 CPU 时间,而是 50ms 的 CPU 时间,因为 CPU 的核心是整数,不能分割,能分割的是占用时间。
这里其实并不会涉及使用率的问题,无论应用将 CPU 用来计算、还是闲置,都会被计算在内。
如果 CPU 使用超过了 CPU Limit 规定的时间,就会被限制使用。这里其实还有一个细节就是,多久调度一次 CPU 的使用。这也是我非常感兴趣的一个问题,在后面的文章中,我会继续分析。
3.2 kubelet 对 Pod CPU 指标的采集
- Prometheus 中的服务发现配置
 1
 2
 3
 4
 5
 6
 7
 8
 9
10
11
12
13
| job_name: kubernetes-nodes-cadvisor
kubernetes_sd_configs:
- role: node
relabel_configs:
- action: labelmap
regex: __meta_kubernetes_node_label_(.+)
- replacement: kubernetes.default.svc:443
target_label: __address__
- regex: (.+)
replacement: /api/v1/nodes/$1/proxy/metrics/cadvisor
source_labels:
- __meta_kubernetes_node_name
target_label: __metrics_path__
|
数据采集的链路是 cAdvisor -> kubelet -> kube-apiserver -> Prometheus。
- cAdvisor 对 CPU 指标的采集
CPU 限流的指标主要是 container_cpu_cfs_throttled_seconds_total 这是 cAdvisor 源码中的定义:
 1
 2
 3
 4
 5
 6
 7
 8
 9
10
11
12
| {
name: "container_cpu_cfs_throttled_seconds_total",
help: "Total time duration the container has been throttled.",
valueType: prometheus.CounterValue,
condition: func(s info.ContainerSpec) bool { return s.Cpu.Quota != 0 },
getValues: func(s *info.ContainerStats) metricValues {
return metricValues{
{
value: float64(s.Cpu.CFS.ThrottledTime) / float64(time.Second),
timestamp: s.Timestamp,
}}
}
|
cAdvisor 获取 CPU 指标的方式:
1
2
3
| spec.Cpu.Limit = readUInt64(cpuRoot, "cpu.shares")
spec.Cpu.Period = readUInt64(cpuRoot, "cpu.cfs_period_us")
quota := readString(cpuRoot, "cpu.cfs_quota_us")
|
内核会动态修改这些容器文件,cAdvisor watch 了这些文件变化,当有文件创建时,说明有新的容器创建;当有文件变更时,说明指标发生了变化,这些都会触发指标的采集。
在容器中,可以看到这些文件:
1
2
3
4
5
| ls /sys/fs/cgroup/cpu
cgroup.clone_children cpu.cfs_quota_us cpu.shares cpuacct.usage cpuacct.usage_percpu_sys cpuacct.usage_user
cgroup.procs cpu.rt_period_us cpu.stat cpuacct.usage_all cpuacct.usage_percpu_user notify_on_release
cpu.cfs_period_us cpu.rt_runtime_us cpuacct.stat cpuacct.usage_percpu cpuacct.usage_sys tasks
|
其中与 CPU 限流相关的文件是
- cpu.cfs_period_us
- cpu.cfs_quota_us
1
2
3
| cat /sys/fs/cgroup/cpu/cpu.cfs_period_us
100000
|
这里的 100000 微秒,也就是 100 ms,即一个 CPU 上 cfs 控制程序使用的周期。
1
2
3
| cat /sys/fs/cgroup/cpu/cpu.cfs_quota_us
200000
|
这里的 200000 微秒,也就是 200 ms,cfs_quota_us 表示总的时间周期,这里的含义是可以同时两个 CPU 核心的 100 ms 时间。
而限流指标存储在这里:
1
2
3
4
5
| cat /sys/fs/cgroup/cpu/cpu.stat
nr_periods 2759610
nr_throttled 5592
throttled_time 30204498882
|
其中,
- nr_periods 已经使用的周期数
- nr_throttled 被限制的周期数
- throttled_time 被限制的时钟长度,单位纳秒
在 Pod 的监控指标中,可以看到:
- Prometheus 对指标的抓取
 1
 2
 3
 4
 5
 6
 7
 8
 9
10
11
12
13
14
15
16
17
| prometheus.yml: |
global:
evaluation_interval: 1m
external_labels:
cluster: mycluster
scrape_interval: 60s
scrape_timeout: 20s
remote_write:
- queue_config:
batch_send_deadline: 2s
capacity: 5000
max_backoff: 5s
max_samples_per_send: 500
min_backoff: 100ms
max_shards: 10000
remote_timeout: 120s
url: http://victoria-metrics-insert/insert/0/prometheus
|
抓取周期较长,为 60s,对于 Counter 类型的指标只会损失精度,而不会错过特征,这与 Gauge 形成了鲜明的对比。
从采集到抓取,没有发现可能错过 CPU 限流监控的地方。
3.3 告警系统会不会错过异常特征
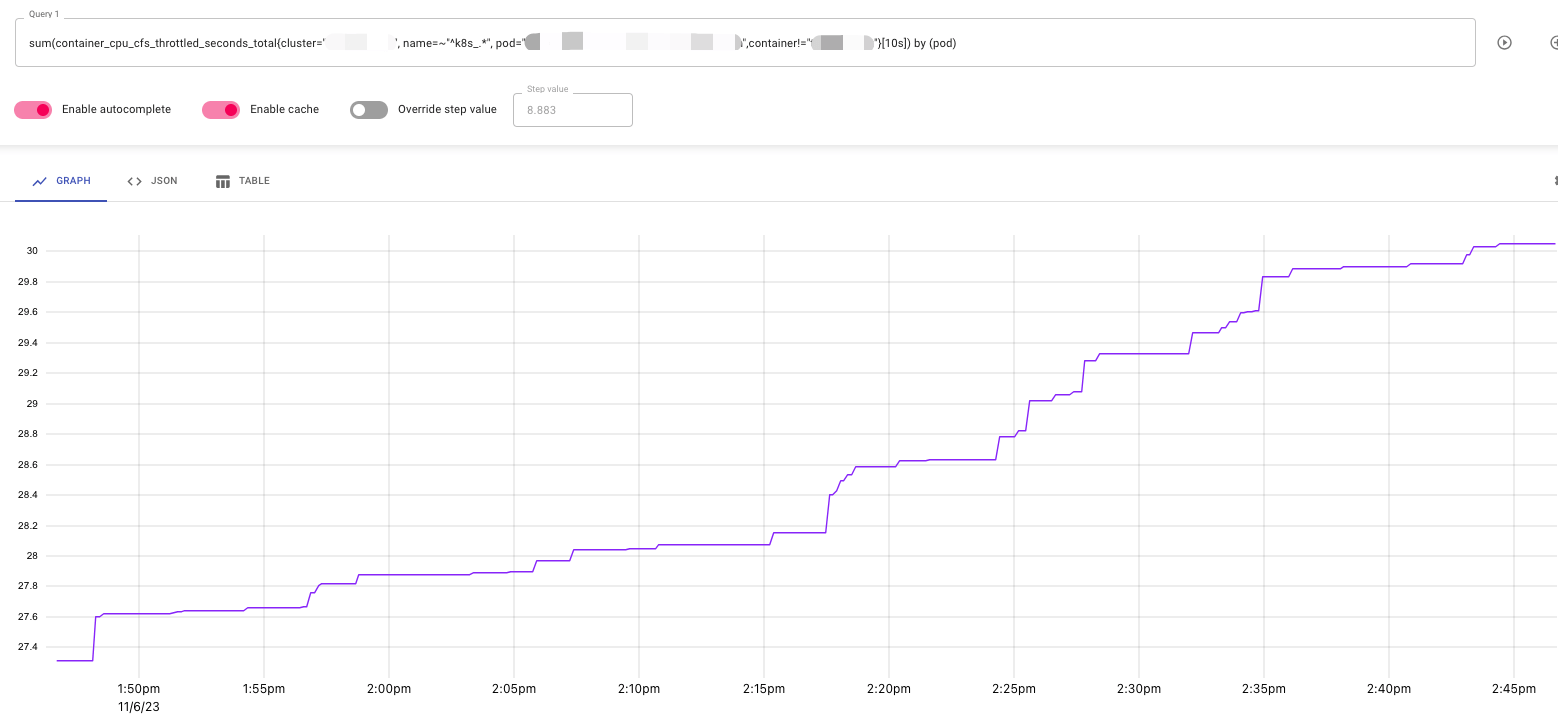
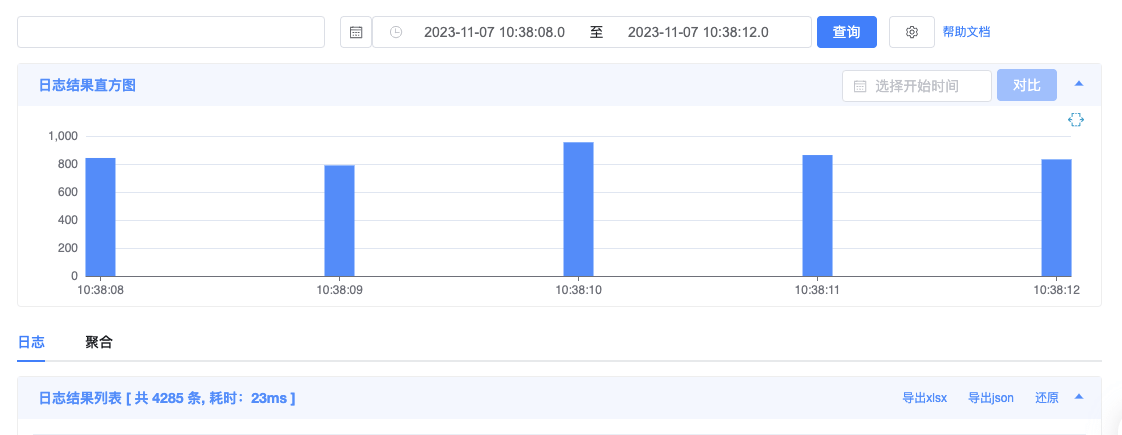
在告警系统中,使用的是 irate 并且时间段是 10s。10s 间隔能看到更多细节,如下图:
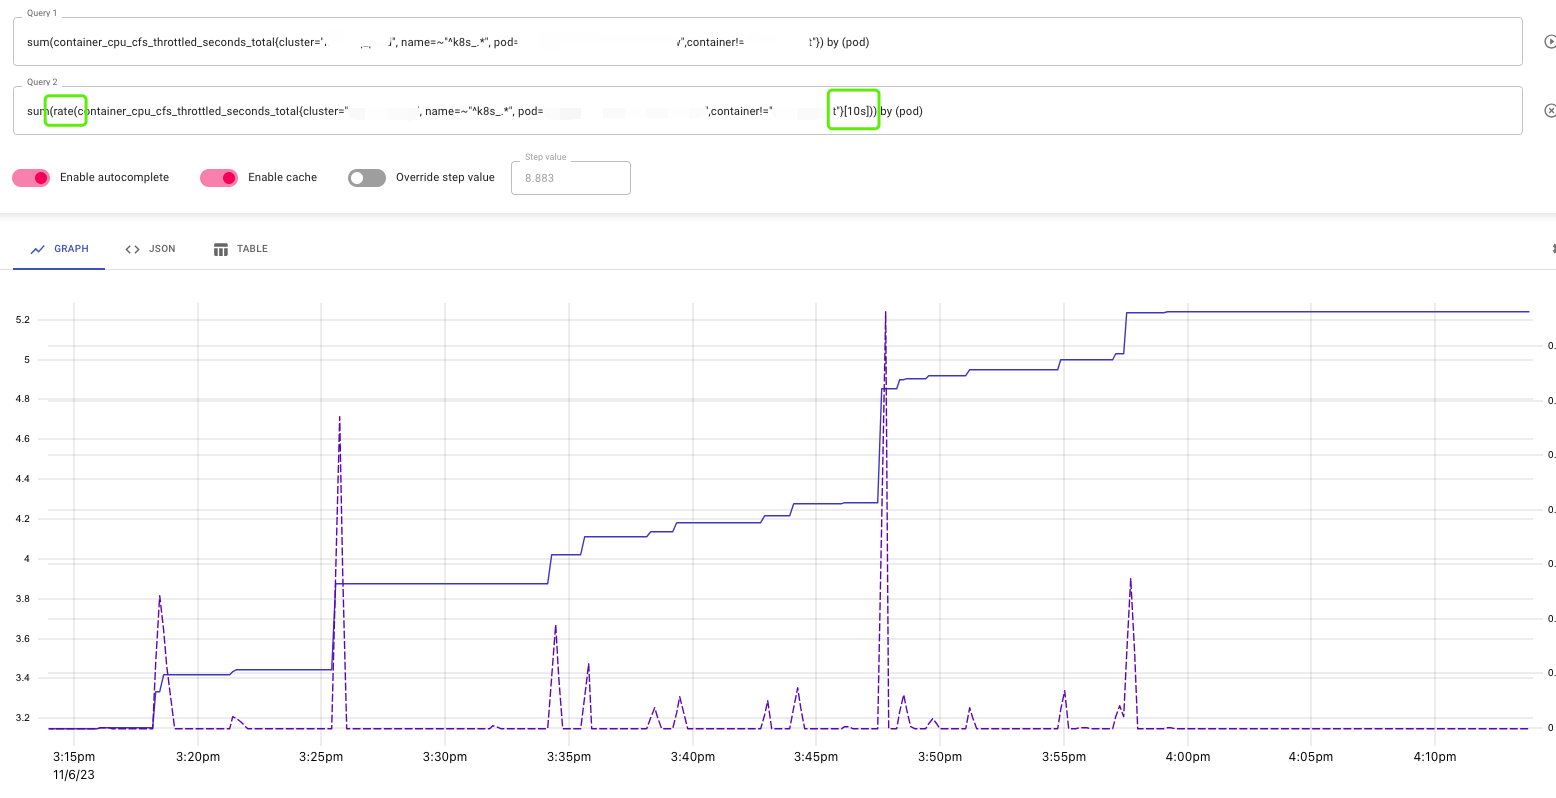
但不利于监控告警,rate 能查看到趋势,5m 间隔有利于监控告警。
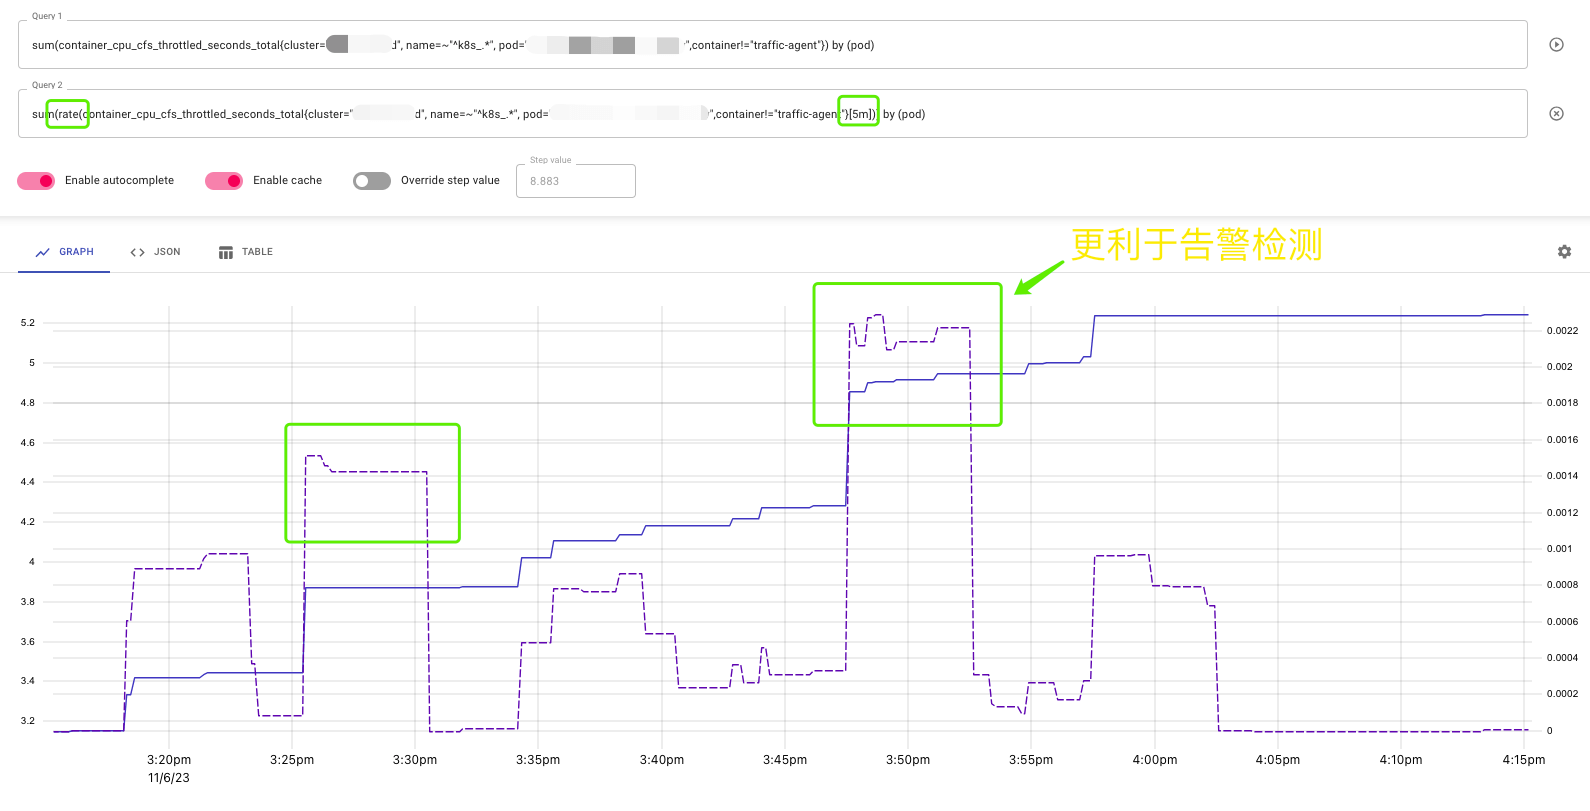
因此可能,有一些 CPU 限流的毛刺,告警系统不能检测到。
但很遗憾的是,在这个场景下,我反复找了很多次,没有发现 CPU 限流的毛刺。
4. 会不会是网络流量转发慢
4.1 kube-proxy 中的异常日志
这里有一段异常的日志引起来了我的注意。
 1
 2
 3
 4
 5
 6
 7
 8
 9
10
11
12
| E1103 07:33:18.156949 1 proxier.go:900] Failed to ensure that nat chain KUBE-MARK-DROP exists: error creating chain "KUBE-MARK-DROP": exit status 4: Another app is currently holding the xtables lock; still 4s 100000us time ahead to have a chance to grab the lock...
Another app is currently holding the xtables lock; still 3s 100000us time ahead to have a chance to grab the lock...
Another app is currently holding the xtables lock; still 2s 100000us time ahead to have a chance to grab the lock...
Another app is currently holding the xtables lock; still 1s 100000us time ahead to have a chance to grab the lock...
Another app is currently holding the xtables lock; still 0s 100000us time ahead to have a chance to grab the lock...
Another app is currently holding the xtables lock. Stopped waiting after 5s.
I1103 07:33:18.157007 1 proxier.go:876] Sync failed; retrying in 30s
I1103 07:33:28.798252 1 trace.go:205] Trace[1195266045]: "iptables save" (03-Nov-2023 07:33:26.573) (total time: 2225ms):
Trace[1195266045]: [2.225081921s] [2.225081921s] END
I1103 07:33:31.892549 1 trace.go:205] Trace[964002782]: "iptables restore" (03-Nov-2023 07:33:28.966) (total time: 2925ms):
Trace[964002782]: [2.925513421s] [2.925513421s] END
I1103 07:33:43.900533 1 trace.go:205] Trace[431351666]: "iptables restore" (03-Nov-2023 07:33:40.759) (total time: 3141ms):
|
原来 kube-proxy 挂载了 /run/xtables.lock,以此仅有一个地方能够操作 iptables。
1
2
3
4
5
| volumeMounts:
- name: kube-proxy
mountPath: /var/lib/kube-proxy
- name: xtables-lock
mountPath: /run/xtables.lock
|
如果主机有其他进程也在操作 iptables,kube-proxy 就会等待。但这个日志时不时出现一次,并且也不符合异常时的时间点。
4.2 kube-proxy 启动配置
 1
 2
 3
 4
 5
 6
 7
 8
 9
10
11
12
13
14
15
16
17
18
19
20
21
22
| cat /var/lib/kube-proxy/config.conf
apiVersion: kubeproxy.config.k8s.io/v1alpha1
bindAddress: 0.0.0.0
bindAddressHardFail: false
clusterCIDR: 10.239.0.0/16
configSyncPeriod: 15m0s
conntrack:
maxPerCore: 32768
min: 131072
tcpCloseWaitTimeout: 1h0m0s
tcpEstablishedTimeout: 24h0m0s
detectLocalMode: ""
enableProfiling: false
healthzBindAddress: 0.0.0.0:10256
hostnameOverride: ""
iptables:
masqueradeAll: false
masqueradeBit: 14
minSyncPeriod: 0s
syncPeriod: 30s
mode: iptables
|
其中,syncPeriod 意味着每隔 30s 全量同步一次 iptables 规则。那么,如果没有同步完成,碰到了下一个 30s 的同步周期,会怎么样呢?
4.3 kube-proxy 更新 iptables 真的很慢
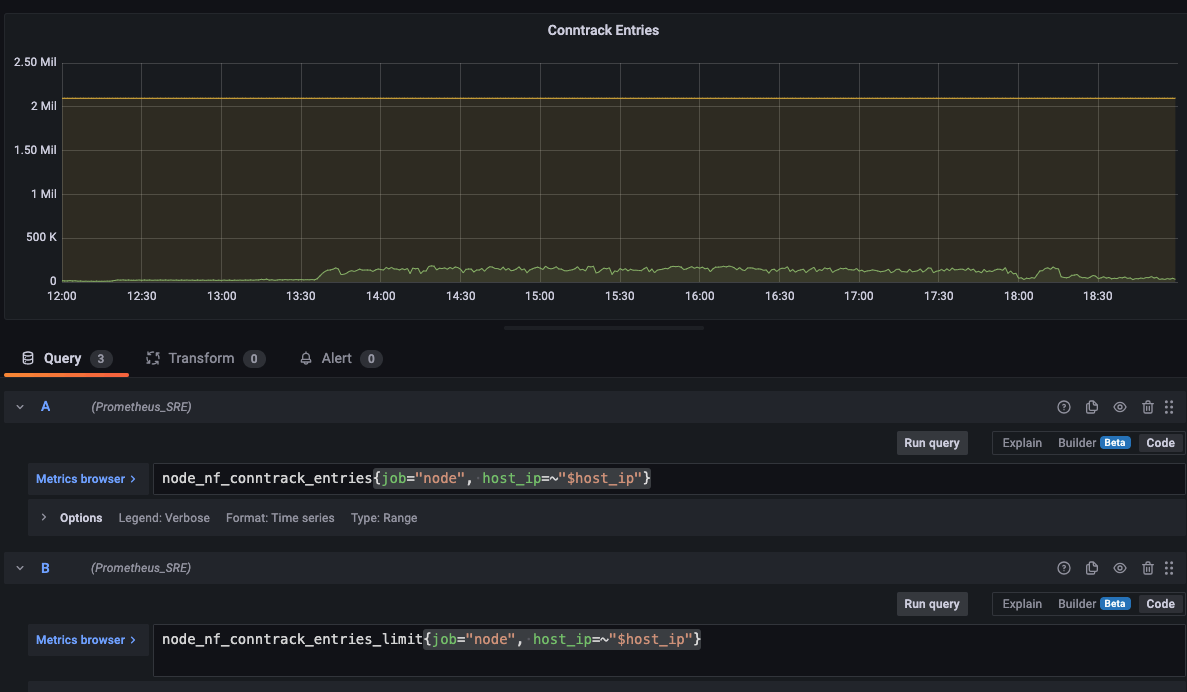
应用 app-b 会大批量下载文件并存储在内存中,导致节点的网络 IO 压力、NF_CONNTRACK 表项、节点的 CPU 压力都剧增。
虽然 Kube-proxy 没有重启、没有 OOMKilled,但 kube-proxy 的 kubeproxy_network_programming_duration_seconds_bucket P99 指标却有异常波动。如下图:
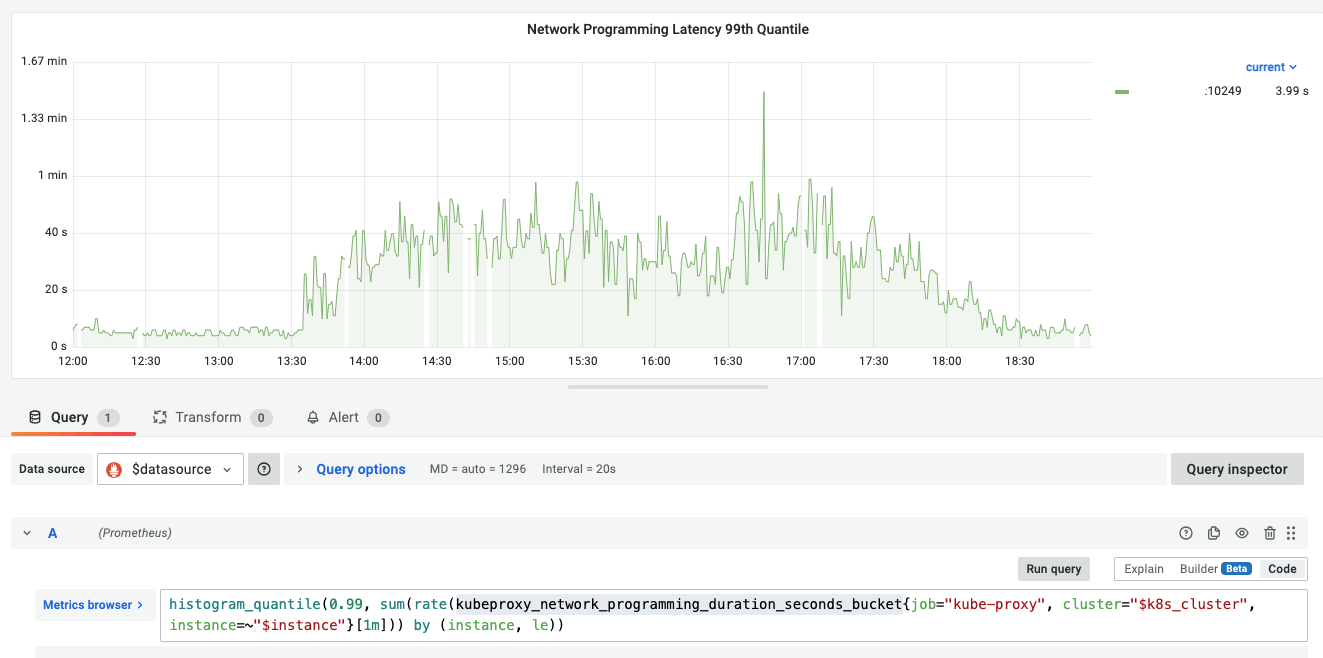
kube-proxy 同步 iptables 规则慢,可能会导致 Pod 的流量摘除不及时,将流量转发到不存在的 Pod 上。
但应用 app-a 异常 timeout 时,并没有 Pod 的重新调度、Pod IP 发生变化的情况发生。
接着,我看了下 nf_conntrack table 的监控值,也没有满,而且上限极高。
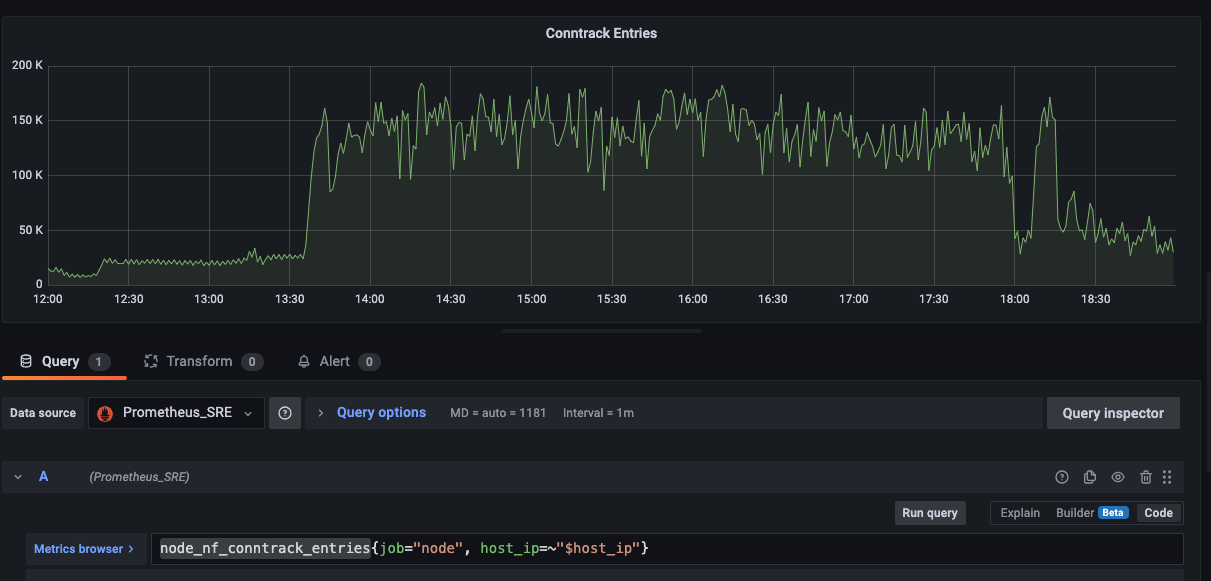
至此,我浪费了很多时间,也没有找到问题的根源。
5. 应用使用 CPU 推理慢
幸运的是,我不仅是 SRE 还负责开发 CICD,直接就去翻了下应用 app-a 的代码。原来应用 app-a 使用 PyTorch 框架在 CPU 上运行推理。
 1
 2
 3
 4
 5
 6
 7
 8
 9
10
11
12
13
14
15
16
17
18
19
20
| self.vocab = pickle.load(open(os.path.join(env.LOCAL_DATA_DIR, 'vocab_xxx.pkl'), 'rb'))
cpu_num = env.CPU_NUM
cpu_num = int(cpu_num)
if cpu_num > 0:
os.environ["OMP_NUM_THREADS"] = str(cpu_num)
torch.set_num_threads(cpu_num)
self.device = torch.device('cpu')
self.model_path = os.path.join(env.CLOUD_DATA_DIR, "xxx_model.ckpt")
config = Config()
config.n_vocab = len(self.vocab)
self.model = xxx_model.Model(config)
self.model = self.model.to(config.device)
if os.path.exists(self.model_path):
self.model.load_state_dict(torch.load(self.model_path, map_location=torch.device("cpu")), False)
else:
raise Exception("Model file not exists")
|
CPU 运行的推理应用与普通应用不同:
虽然提供了大量的 CPU,但 CPU 使用率很低,同时有大量推理任务依然需要 3-257s,高峰期慢推理能达到 800 /秒。
至此,没有其他线索了,并不全是 IaaS 层资源的问题,主要是 CPU 扛不住低延时、大吞吐的推理任务。
6. 总结
本篇主要是记录了一次应用慢的排查过程。最后没有找到问题的根源,但发现了不少目前大集群的问题。
排查应用慢时的思路主要如下:
- CPU 限流,看 Pod 的 CPU 指标、节点的 CPU 指标是否有异常
- 磁盘 IO 慢,看 iowait、iops、io 队列数、读写延迟等是否有异常
- 网络慢,沿着流量路径,查看网络指标是否有异常
- 应用依赖的服务,本篇中的 app-a 没有外部依赖,因此跳过了这个环节
由于这次碰到的是一个推理应用,其实还会涉及输入文本的长度、BATCH_SIZE 大小、模型的复杂度等因素,但这些因素都是应用层的问题,不在本篇的讨论范围。
