Helm 是 Kubernetes 的包管理工具;Operator 用于管理 Kubernetes 的有状态分布式应用。本文主要描述如何使用 Helm、Operator 在 Minikube 集群上快速部署 Prometheus,并使用 Grafana 查看监控数据。Minikube 安装可以参考,搭建远程 Kubernetes 开发环境,Helm 配置可以参考,Kubernetes 的包管理器 – Helm,Operator 可以参考,Kubernetes复杂有状态应用管理框架–Operator。
1. 安装 Prometheus Operator
1
| helm install --name prometheus-operator --namespace=monitoring stable/prometheus-operator
|
2. 安装 Prometheus
1
| helm install --name prometheus --set serviceMonitorsSelector.app=prometheus --set ruleSelector.app=prometheus --namespace=monitoring stable/prometheus
|
3. 安装 Alertmanager
1
| helm install --name alertmanager --namespace=monitoring stable/alertmanager
|
4. 暴露服务
为了方便访问 Prometheus 和 Grafana,我们将 Service 类型改为 NodePort。
查看服务,找到对应的服务名:
1
| kubectl get svc -n monitoring
|
暴露服务:
1
2
| kubectl patch svc prometheus-operator-grafana -p '{"spec":{"type":"NodePort"}}' -n monitoring
kubectl patch svc prometheus-operator-prometheus -p '{"spec":{"type":"NodePort"}}' -n monitoring
|
查看服务,找到对应的访问端口:
 1
 2
 3
 4
 5
 6
 7
 8
 9
10
11
12
13
14
15
| kubectl get svc -n monitoring
NAME TYPE CLUSTER-IP EXTERNAL-IP PORT(S) AGE
alertmanager-operated ClusterIP None <none> 9093/TCP,6783/TCP 16h
prometheus-alertmanager ClusterIP 10.98.63.83 <none> 80/TCP 16h
prometheus-kube-state-metrics ClusterIP None <none> 80/TCP 16h
prometheus-node-exporter ClusterIP None <none> 9100/TCP 16h
prometheus-operated ClusterIP None <none> 9090/TCP 16h
prometheus-operator-alertmanager ClusterIP 10.105.201.137 <none> 9093/TCP 16h
prometheus-operator-grafana NodePort 10.110.199.163 <none> 80:32467/TCP 16h
prometheus-operator-kube-state-metrics ClusterIP 10.104.56.81 <none> 8080/TCP 16h
prometheus-operator-operator ClusterIP 10.105.127.162 <none> 8080/TCP 16h
prometheus-operator-prometheus NodePort 10.104.241.128 <none> 9090:32044/TCP 16h
prometheus-operator-prometheus-node-exporter ClusterIP 10.96.160.143 <none> 9100/TCP 16h
prometheus-pushgateway ClusterIP 10.100.107.222 <none> 9091/TCP 16h
prometheus-server ClusterIP 10.107.184.180 <none> 80/TCP 16h
|
Grafana 访问入口:http://your_host_ip:32467, Prometheus 访问入口:http://your_host_ip:32044。
5. 查找 admin 账户密码
1
| kubectl get secret --namespace monitoring prometheus-operator-grafana -o jsonpath="{.data.admin-password}" | base64 --decode ; echo
|
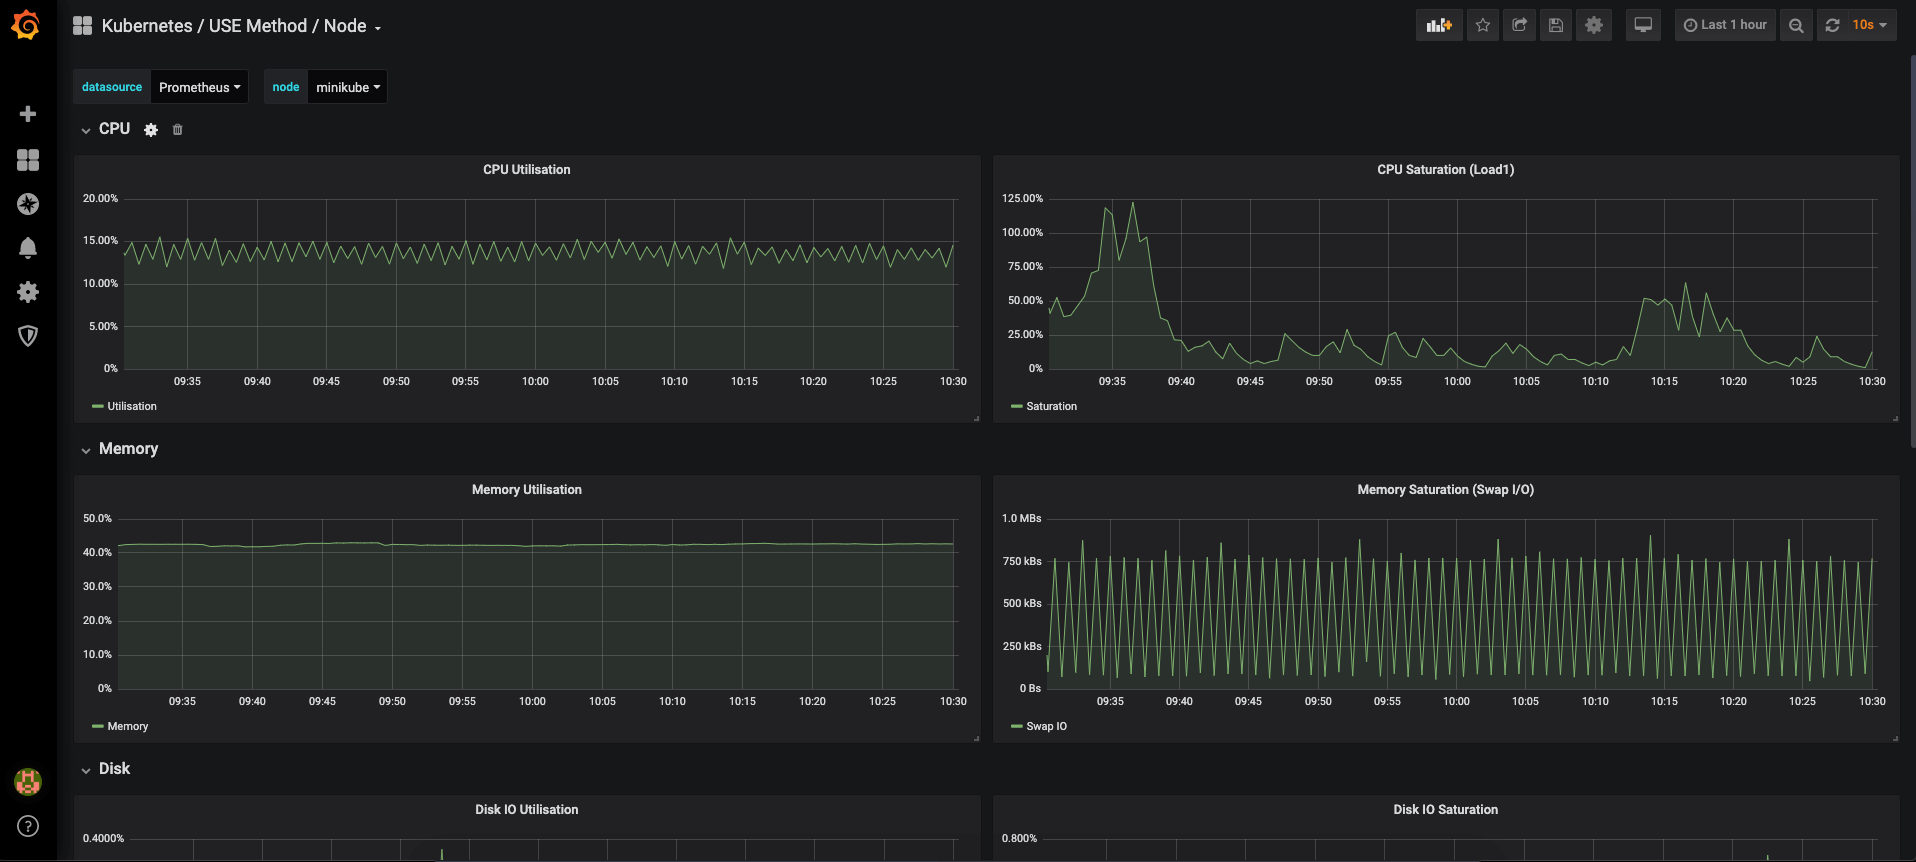
Grafana 页面:
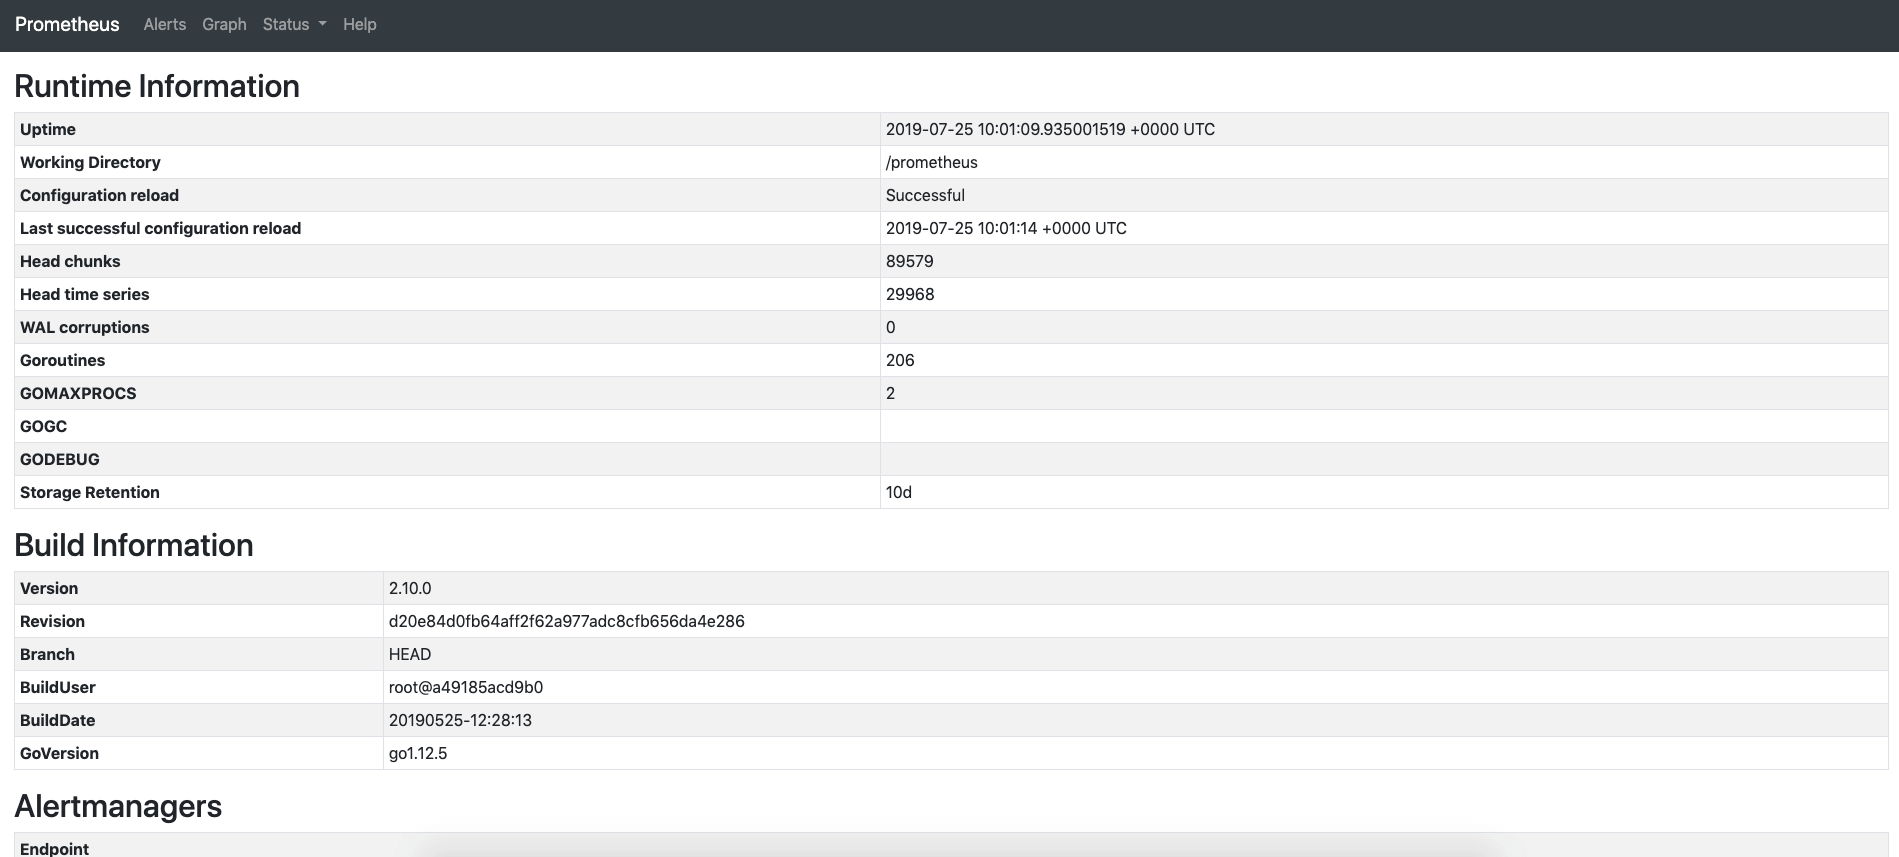
Prometheus 页面: